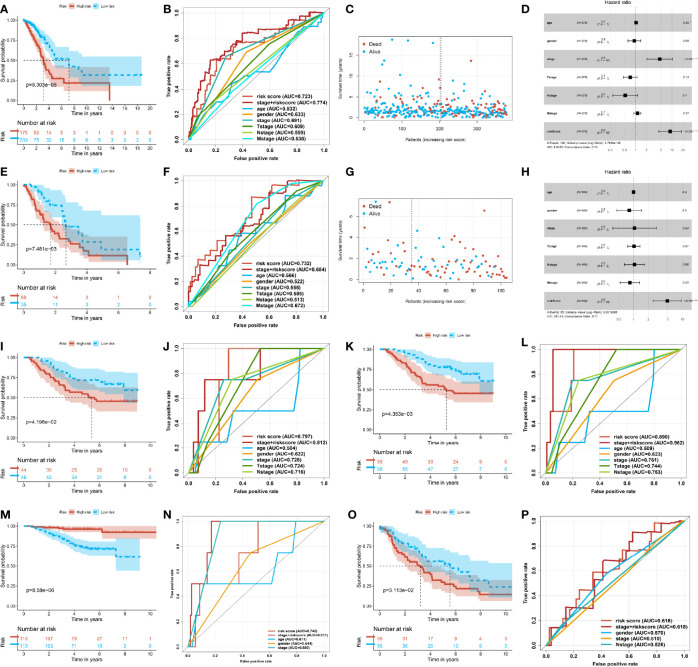
Figure 3.
Stability and predictive power of the prognostic risk model. (A) Kaplan–Meier curve of the high- and low-risk group in the early lung adenocarcinoma (LUAD) of The Cancer Genome Atlas (TCGA). (B) Receiver operating characteristic (ROC) curve of the risk score and other clinical indexes in the early LUAD of TCGA. (C) Scatter plot of the survival time and risk score in the early LUAD of TCGA. (D) Forest plot of multivariate Cox regression analysis of the risk score and clinical factors for the early LUAD of TCGA. (E) Kaplan–Meier curve of the high- and low-risk groups in the progressive LUAD of TCGA. (F) ROC curve of the risk score and other clinical indexes in the progressive LUAD of TCGA. (G) Scatter plot of the survival time and risk score in the progressive LUAD of TCGA. (H) Forest plot of the multivariate Cox regression analysis of the risk score and clinical factors for the progressive LUAD of TCGA. (I) Kaplan–Meier curve of the high- and low-risk groups of GSE11969. (J) ROC curve of the risk score and other clinical factors from GSE11969. (K) Kaplan–Meier curve of the high- and low-risk groups of patients from GSE13213. (L) ROC curve of the risk score and other clinical factors of GSE13213. (M) Kaplan–Meier curve of the high- and low-risk groups of patients from GSE31210. (N) ROC curve of the risk score and other clinical factors of GSE31210. (O) Kaplan–Meier curve of the high- and low-risk groups of patients from GSE36471. (P) ROC curve of the risk score and other clinical factors of patients from GSE36471.

