Figure 5.
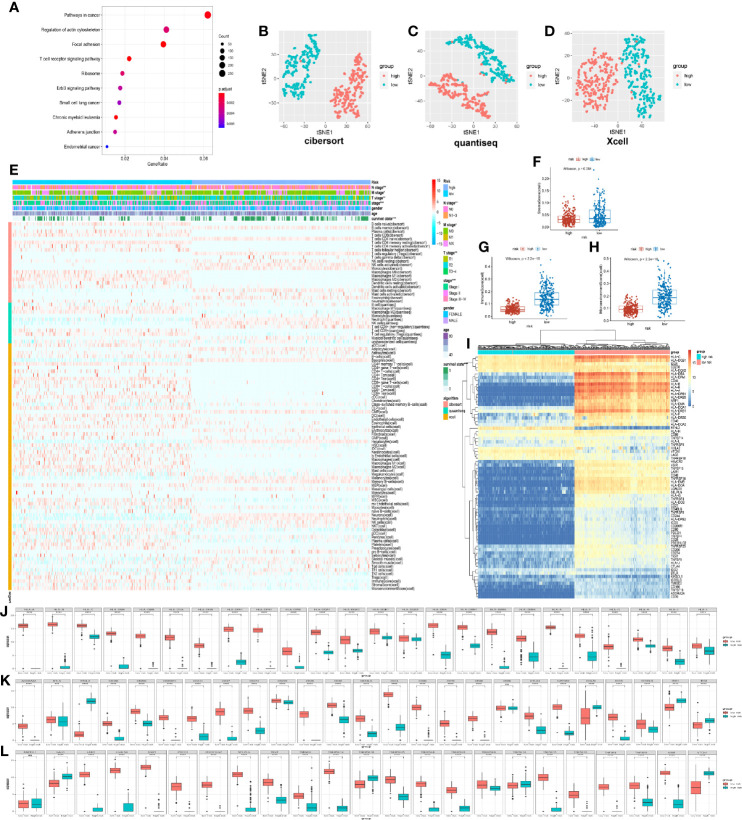
Immune characteristic of prognostic risk model stratification. (A) Kyoto Encyclopedia of Genes and Genomes pathway enrichment of different expression genes of high and low risk, demonstrating the top 10. (B) t-distributed stochastic neighbor embedding (t-SNE) analysis of 22 immune cells based on CIBERSORT algorithm. (C) t-SNE analysis of 11 immune cells based on QUANTISEQ algorithm. (D) t-SNE analysis of 64 immune and stroma cells based on XCELL algorithm. (E) Heat map demonstrating immune cell infiltration in the high- and low-risk groups in the TCGA databases. The low-risk group had a higher immune infiltration. P-values were calculated with chi-square test. The additional annotation of the abscissa included other clinical indexes from TCGA, such as survival state, age, gender, stage, T stage, N stage, M stage, and risk group. The annotation of the vertical axis included three immune infiltrated algorithms, namely, XCELL, QUANTISEQ, and CIBERSORT. (F–H) Box plot showing the difference between the high- and low-risk groups about immune score, stroma score, and microenvironment score. (I) Heat map demonstrating the difference of human leukocyte antigen (HLA) and immune checkpoint for the high- and low-risk groups. (J) Different expression of the HLA gene in the high- and low-risk groups from TCGA. (K, L) Different expression of immune checkpoints in the high- and low-risk group from TCGA.

