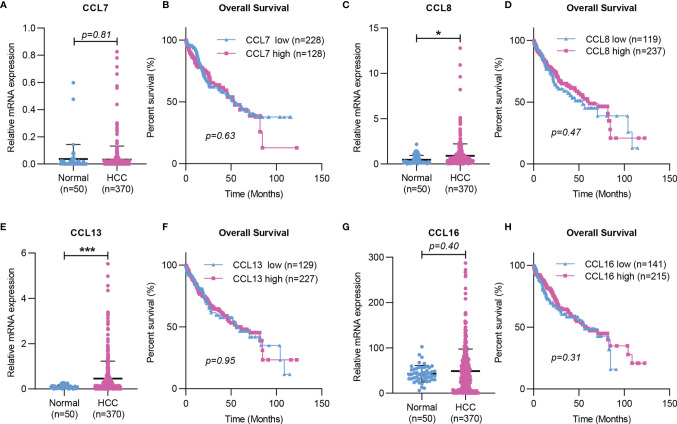
Figure 3.
Expression and Kaplan-Meier survival curves of CCL7, CCL8, CCL13, and CCL16 in HCC based on TCGA. (A, C, E, G) The mRNA expression of CCL7, CCL8, CCL13, and CCL16 in HCC tissues was determined by RNA-seq data from the TCGA LIHC dataset. (B, D, F, H) The correlation of CCL7, CCL8, CCL13, and CCL16 mRNA expression levels with overall survival time was determined by RNA-seq in the TCGA LIHC dataset. TCGA, The Cancer Genome Atlas. (*P < 0.05; ***P < 0.001).

