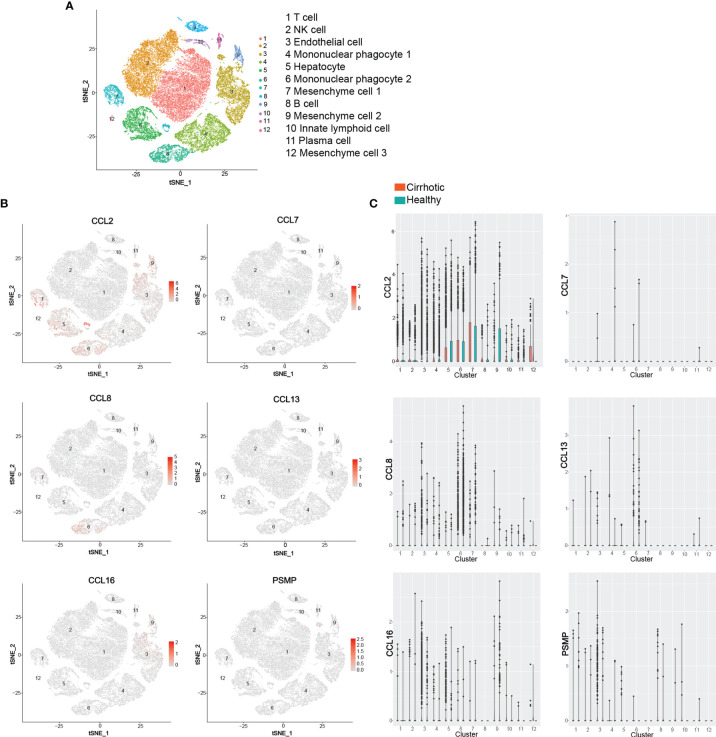
Figure 4.
ScRNA-seq analysis of human liver. (A) t-SNE projection showing a reference map of 12 liver cell clusters with established cell-specific marker genes in human liver. (B, C) t-SNE plots showing relative distribution of CCL2, CCL7, CCL8, CCL13, CCL16 and PSMP in the 12 identified cell clusters in human healthy and cirrhotic liver and its statistical summary. scRNA-seq: Single-cell RNA sequencing; t-SNE: t-distributed stochastic neighbor embedding.

