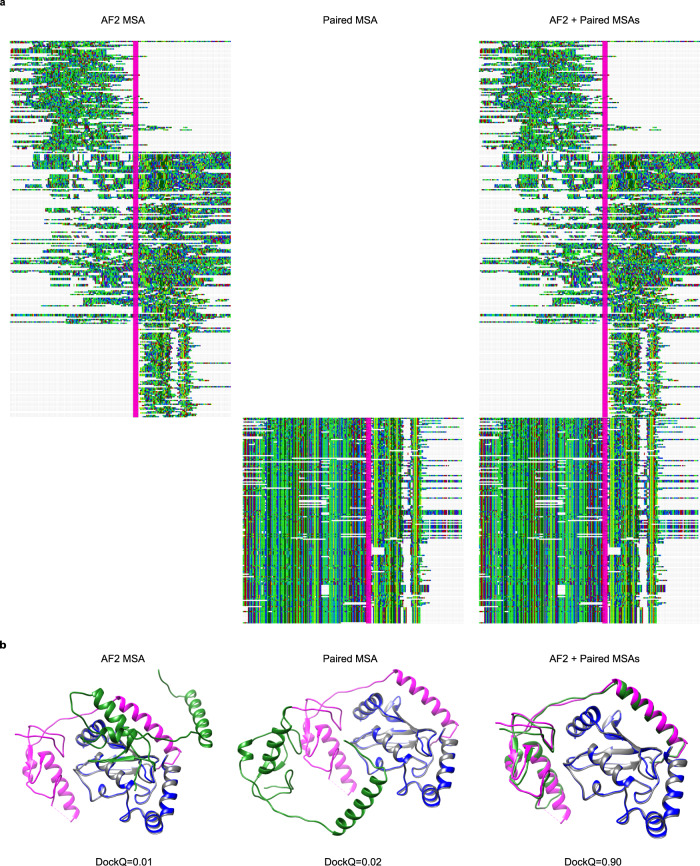
Fig. 6. Comparison of different MSAs.
a Depiction of MSAs generated by AF2 and the paired version matched using organism information. Both AF and paired representations are sections containing 10% of the sequences aligned in the original MSA. Concatenated chains are separated by a vertical line (magenta). The visualisations were made using Jalview version 2.11.1.449. b Docking visualisations for PDB ID 5D1M with the model/native chains A in blue/grey and B in green/magenta using the three different MSAs in (a). The DockQ scores are 0.01, 0.02 and 0.90 for AF2, paired, and AF2 + paired MSAs, respectively.

