
Figure 5.
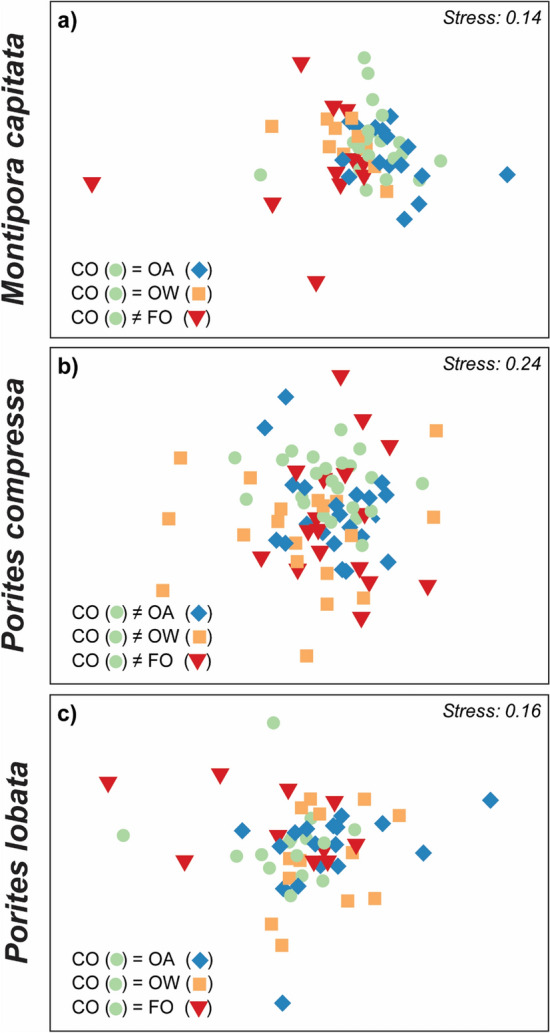
Nonparametric multidimensional scaling plots (NMDS) of coral physiological profiles for (a) Montipora capitata, (b) Porites compressa, and (c) Porites lobata. Data colors correspond to treatments: controls (CO, green circles), ocean acidification (OA, blue diamonds), ocean warming (OW, orange squares), or combined future ocean (FO, red triangles) treatments. Summary of pairwise PERMANOVA tests between CO and each of the treatments is shown in the bottom left of each panel. Additional statistical details in Table S7.