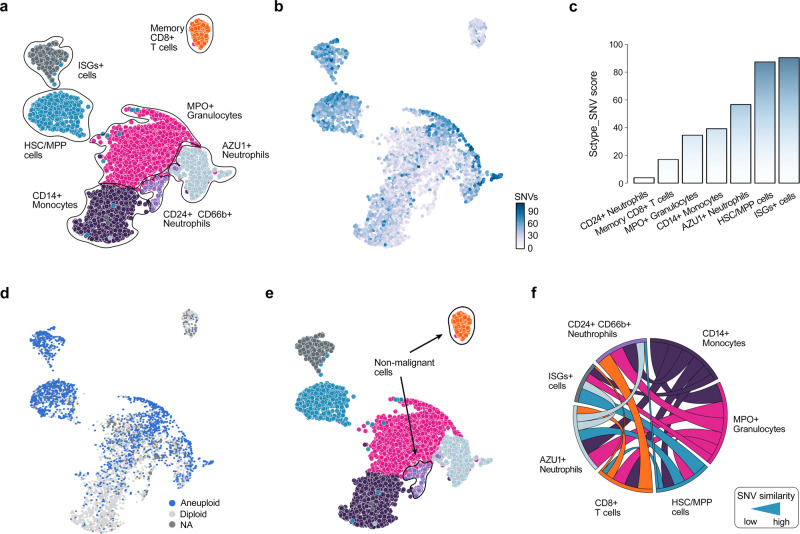
Fig. 4. ScType enables SNV calling directly from the scRNA-seq profiles.
a UMAP plot of the cell types in the AML patient sample automatically annotated with ScType. b Distribution of somatic SNVs in the cancer consensus genes across the various cell types of the patient. c ScType SNV score summarizes the number of point mutations in the cancer genes for each cell type, shown as the percentage of SNVs above the median SNV value within the particular cell cluster. d UMAP showing aneuploid and diploid cell classification based on Bayesian segmentation approach CopyKAT41. e ScType assigns cell types as non-malignant when the ScType SNV score is below 20 and more than 50% of cells within the cell-type are classified as diploid. f Chord diagram shows the associations between different cell types in terms of the similarity of their SNVs in the cancer genes (i.e., occurrence of common SNVs, see Methods for details). The width of a connection corresponds to the degree of SNV similarity between cell-types, while the connection color indicates a specific cell-type as shown in the UMAP plot in panel a.

