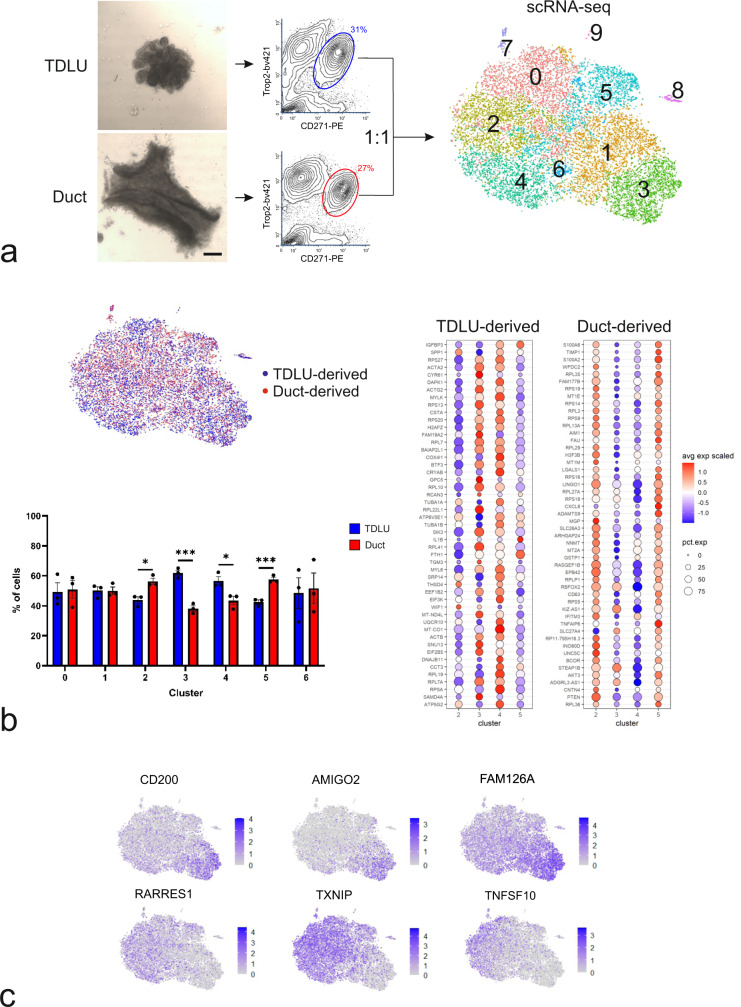
Fig. 1. Spatial mapping of MEP progenitors at the single-cell level.
a (left) Phase-contrast micrographs of representative micro-collected TDLU and duct (scale bar, 200 μm). (middle) Contour FACS plots of single cells from trypsinized, micro-collected organoids labelled with Trop2 and CD271 for sorting of MEP cells (circles indicate approximate gates and percentages of isolated cells) derived from TDLU (blue) and ducts (red), respectively, which were submitted to scRNA-seq. (right) t-SNE plot of the integrated scRNA-seq profiles of 18,678 cells from three biopsies, subdivided by unsupervised clustering into clusters 0-9, indicated by separate coloring. b (left, upper) Same t-SNE plot as in a, colored to show MEP cells derived from TDLUs (blue) and ducts (red), respectively. (Left, lower) Bar graph depicting the contribution of TDLU- or duct-derived MEP cells to each cluster. Bars show mean ± standard error of mean (SEM) (*p < 0.05 and ***p < 0.005 by multiple unpaired t tests with Bonferroni correction, n = 3 biopsies). (right) Cluster-assigned bubble plots of the fifty most up-regulated TDLU-derived and duct-derived DEGs in clusters 2–5. Color indicates the average expression across cells within a cluster and the size indicates the percentage of expressing cells. c Same t-SNE plot as in A, colored according to genes expression levels from 0 (grey, low expression) up to 4 (purple, high expression). CD200, AMIGO2, and FAM126A are upregulated, while RARRES1, TXNIP, and TNFSF10 are downregulated in cluster 3.

