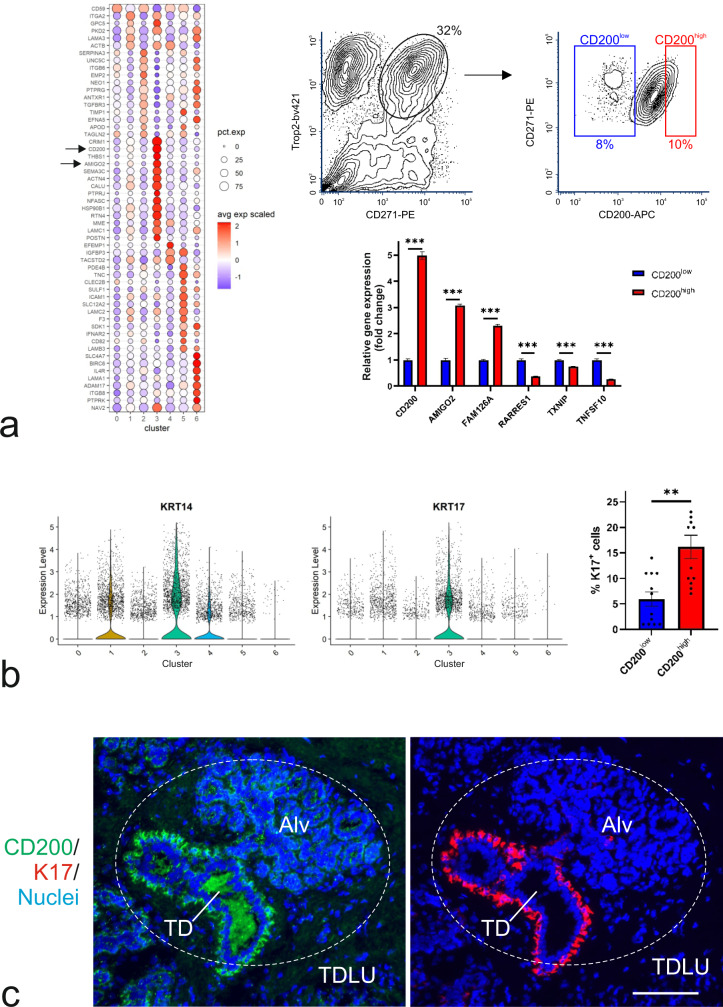
Fig. 2. CD200 is a marker for a distinct MEP subpopulation.
a (left) Cluster-assigned bubble plot of cluster-specific DEGs encoding cell-surface markers confirms expression of CD200 and AMIGO2 in cluster 3 (arrows). (right, upper) Contour FACS plots of crude preparation of breast organoids isolated with Trop2 and CD271, followed by gating for MEP cells (encircled with the approximate percentage of cells indicated), subsequently sorted according to CD200 and CD271 to isolate CD200low (blue) and CD200high (red) cells, respectively. (right, lower) Bar graph of the fold change of normalized relative gene expression by RT-qPCR show upregulation of CD200, AMIGO2 and FAM126A, and downregulation of RARRES1, TXNIP and TNFSF10 in CD200high (red) versus CD200low (blue). Bars indicate mean ± SEM (***p < 0.005 by multiple t tests with Bonferroni correction, n = 3). b (left) Violin plots of KRT14 and KRT17 expression levels reveal upregulation of both in cluster 3. (right) Bar graph of quantification of immunostaining of smears from CD200low (blue) and CD200high (red) MEP cells confirms a significantly higher frequency (% K17+ cells) among CD200high cells. Bars indicate mean ± SEM (**p = 0.005 by two-tailed Mann-Whitney test, n = 6 smears from two biopsies). c Representative images of cryosection of normal breast stained by immunofluorescence for CD200 (green), K17 (red), and nuclei (blue) show co-localization of CD200 and K17 in the terminal duct (TD) rather than alveoli (Alv) of a TDLU (encircled, scale bar, 100 μm).

