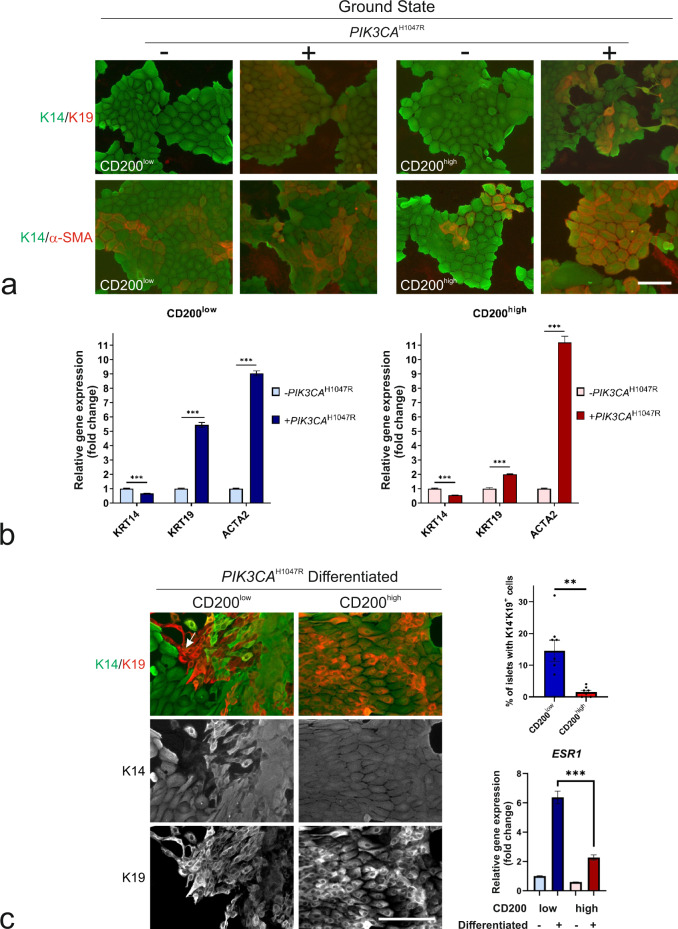
Fig. 4. Mutant PIK3CA destabilizes ground state phenotype without affecting differentiation repertoire.
a Fluorescence micrographs of (left) CD200low-hTERT-shp53 and (right) CD200high-hTERT-shp53 without (−) or with (+) mutant PIK3CA (PIK3CAH1047R) in Myo+ (Ground state) show apparent maintenance of K14 (green) and increase in K14+/K19+ (red) and K14+/α-SMA+ (α-SMA, red) upon PIK3CAH1047R expression in both cell lines (scale bar, 50 μm). b Bar graphs of fold change of normalized relative gene expression by RT-qPCR in CD200low-hTERT-shp53-PIK3CAH1047R (blue) and CD200high-hTERT-shp53-PIK3CAH1047R (red) strains relative to CD200-hTERT-shp53 strains show a somewhat reduced KRT14 in both lines, increased KRT19, and in CD200low in particular, a much higher expression of ACTA2 with mutant PIK3CA. Bars indicate mean + SEM (***p < 0.005 by multiple unpaired t tests with Bonferroni correction, n = 3). c (left) Micrographs of fluorescence stainings of (left column) CD200low-hTERT-shp53-PIK3CAH1047R and (right column) CD200high-hTERT-shp53-PIK3CAH1047R in MEGM+ (Differentiated) reveal a significantly higher number of colonies with K14−/K19+ (red, arrow) cells in CD200low versus CD200high (scale bar, 50 μm). (right, upper) Bars indicate mean ± SEM (**p < 0.01 by unpaired, two-tailed t test, n = 8). (right, lower) Normalized relative gene expression of ESR1 in CD200low (blue) versus CD200high (red) by RT-qPCR shows a relative, significant increase of ESR1 in CD200low upon differentiation (+) versus ground state (−). Bars indicate mean ± SEM (***p < 0.005 by one-way ANOVA with Tukey’s multiple comparison test, n = 3).

