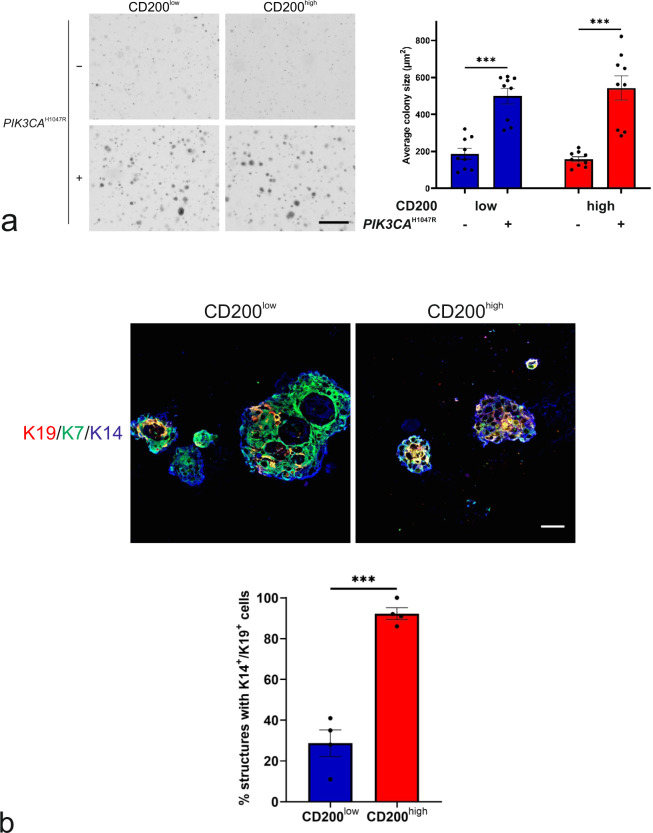
Fig. 5. Mutant PIK3CA partially transforms CD200low and CD200high MEP progenitors.
a (left) Phase contrast micrographs of colonies formed in soft agar by (left column) CD200low-hTERT-shp53 (CD200low) and (right column) CD200high-hTERT-shp53 (CD200high) without (−) or with (+) mutant PIK3CA (PIK3CAH1047R) in Myo+ at normoxia (scale bar, 500 μm) and (right) quantification of average colony size show that both cell lines form more colonies of larger size with mutant PIK3CA. Bars indicate mean ± SEM (***p < 0.005 by Kruskal-Wallis test with Dunn’s multiple comparison test, n = 9). b (upper) Micrographs of fluorescence stainings of cryosections stained for K7 (green), K19 (red) and K14 (blue) of structures formed in rBM by CD200low-hTERT-shp53-PIK3CAH1047R (CD200low) and CD200high-hTERT-shp53- PIK3CAH1047R (CD200high) (scale bar, 100 μm) and (lower) quantification of structures including K14+/K19+ cells show a significantly higher frequency of structures with destabilized phenotype in CD200high. Bars indicate mean +/− SEM (***p < 0.005 by unpaired, two-tailed t test, n = 4).

