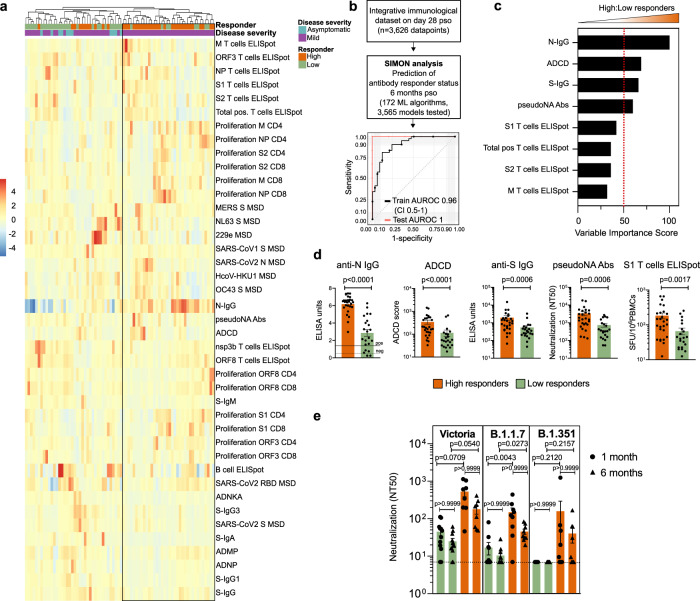
Fig. 7. Early signature of durable SARS-CoV2 immune responses.
a Hierarchical clustering heatmap of immune parameters on day 28 pso, grouping by responder status 6 months pso and disease severity. Results obtained using complete linkage agglomeration method, dendrogram ordered tightest cluster first. b Integrative immunological dataset containing 3,626 datapoints (49 features and 74 donors) was used for SIMON analysis to predict if the individual will generate high or low anti-N antibody responses 6 months pso. In total, 172 ML algorithms were tested and 3565 model built. ROC plot of the best performing model built with the svmPoly algorithm. Train AUROC (black line) is determined using 10-fold cross-validation and test AUROC evaluated on the independent test set (25% of the initial dataset). c Top variables that contribute to the model and are increased in high relative to low responders. d Frequency of selected variables on day 28pso (bars show mean with SEM). Mann–Whitney test (p < 0.05). (e) Neutralisation assay against wild-type SARS-CoV2 (Victoria), and two novel variants (B1.1.7 and B1.351) between high and low responders on two timepoints (one and 6 months pso). Plots show mean with SEM. A Kruskal-Wallis (one-way ANOVA on ranks), with Dunn’s multiple comparison test (p < 0.05) was performed (ns; adjusted P value > 0.9999).

