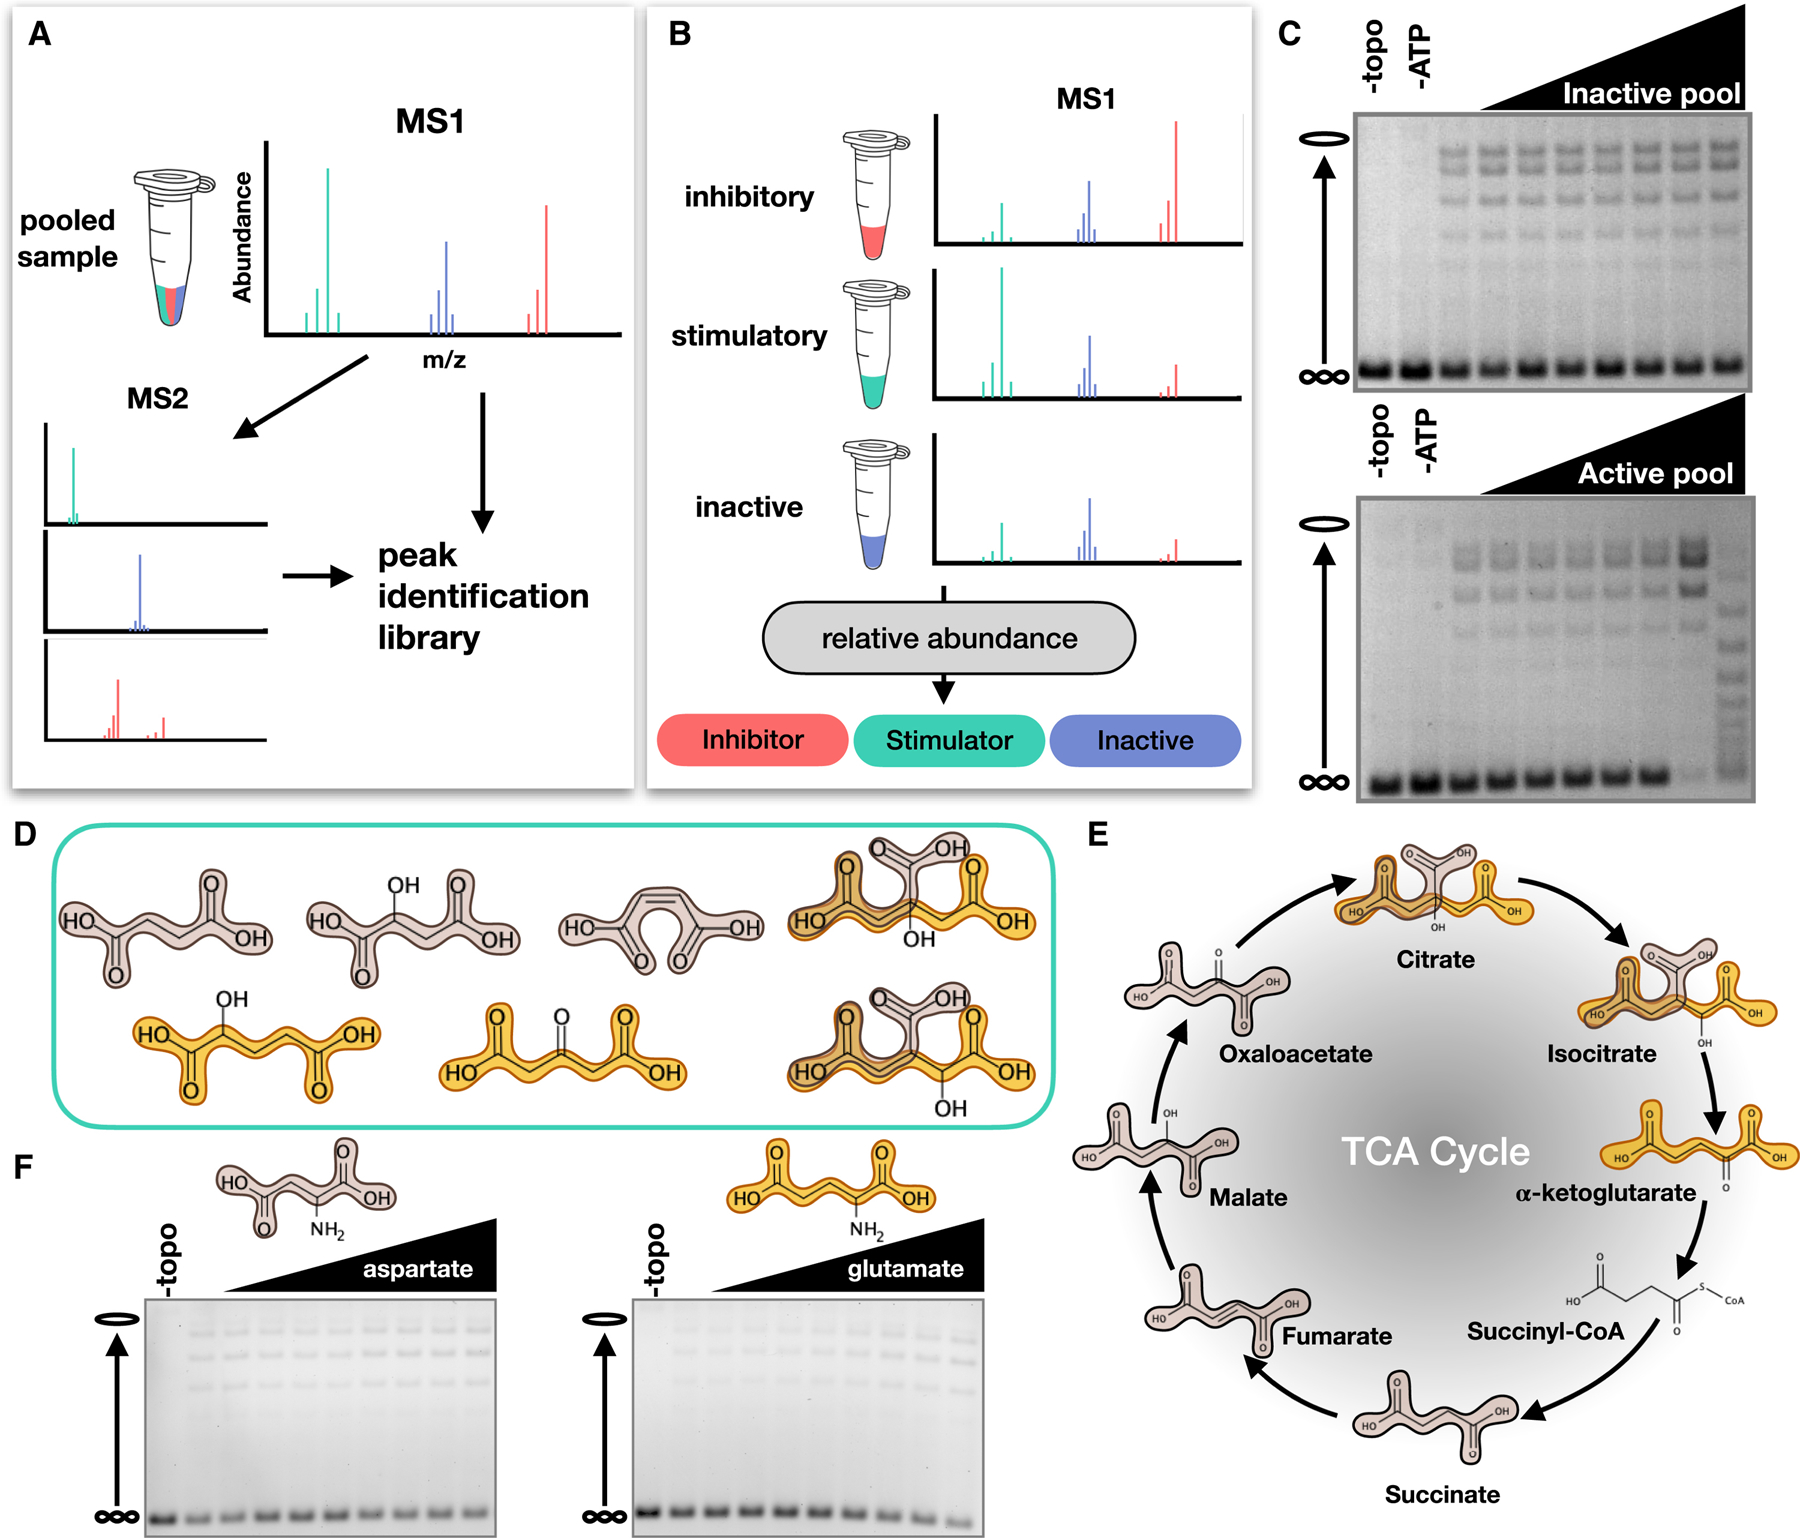
Figure 3. Identification and structure activity relationship (SAR) analysis of stimulatory compounds.

(A) Schematic depicting LC-MS/MS analysis of metabolite fractions to generate an ion peak-identification library. (B) Schematic depicting the individual analysis of metabolite fractions. (C) Example supercoil relaxation assays from testing an inactive and active pool of five candidate compounds. Each candidate compound was titrated from 0 to 20 mg/ml in two-fold steps. (D) Representative compounds with stimulatory activity. Succinic acid (tan) and glutaric acid (gold) motifs are highlighted. (E) TCA cycle metabolites. (F) Effects of dicarboxylic amino acids on topo II supercoil relaxation activity. Aspartate and glutamate were titration from 0 to 40 mM in 5 mM increments.
