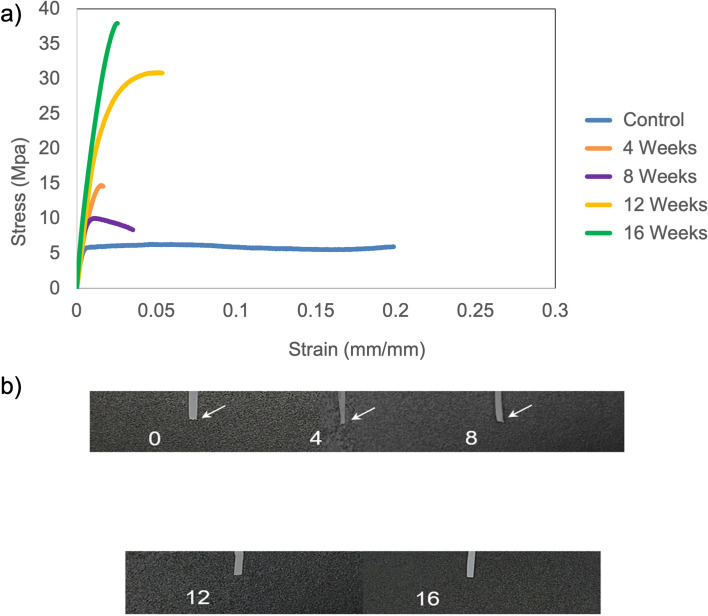
Figure 5.
Mechanical integrity changes on exposure to amniotic fluid. (a) Representative stress–strain curves for control (0 weeks) and 4, 8, 12 and 16-week patch exposure to amniotic fluid. For each time point, the stress–strain curve of one specimen was chosen randomly out of the five specimens tested. These curves were plotted on the graph to study changes in the mechanical behavior of the patch, i.e. PLA-PCL blend. (b) White arrows indicate presence of necking phenomenon, i.e. stretching of the specimen at the point of fracture. Absence of white arrows indicates brittle fracture.

