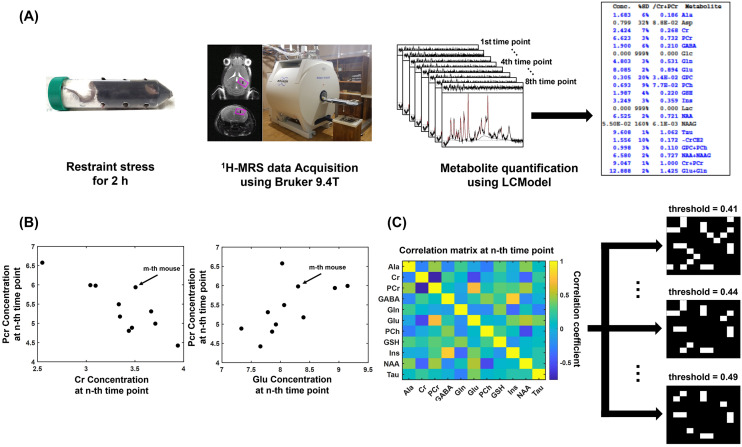
Figure 1.
A flowchart for the construction of the metabolic network using metabolite concentration from a proton magnetic resonance spectroscopy (H-MRS). (A) Concentration of each metabolite from H-MRS acquired by a Bruker 9.4T scanner was estimated using LCModel. (B) Metabolic connection was defined as statistic association in the concentration between two metabolites. As an example of metabolic connections using concentration correlations used in the present study, we demonstrated that the concentration of PCr had a significant association with those of Cr and Glu. (C) The Correlation matrix was binarized by assigning one to entries above the threshold and 0 to entries under the threshold. Ala, alanine; Cr, creatine; PCr, phosphocreatine; GABA, -aminobutyric acid; Glu, glutamate; Gln, glutamine; PCh, phosphorylcholine; GSH, glutathione; Ins, myo-inositol; NAA, N-acetylaspartate; Tau, taurine.

