Figure 3.

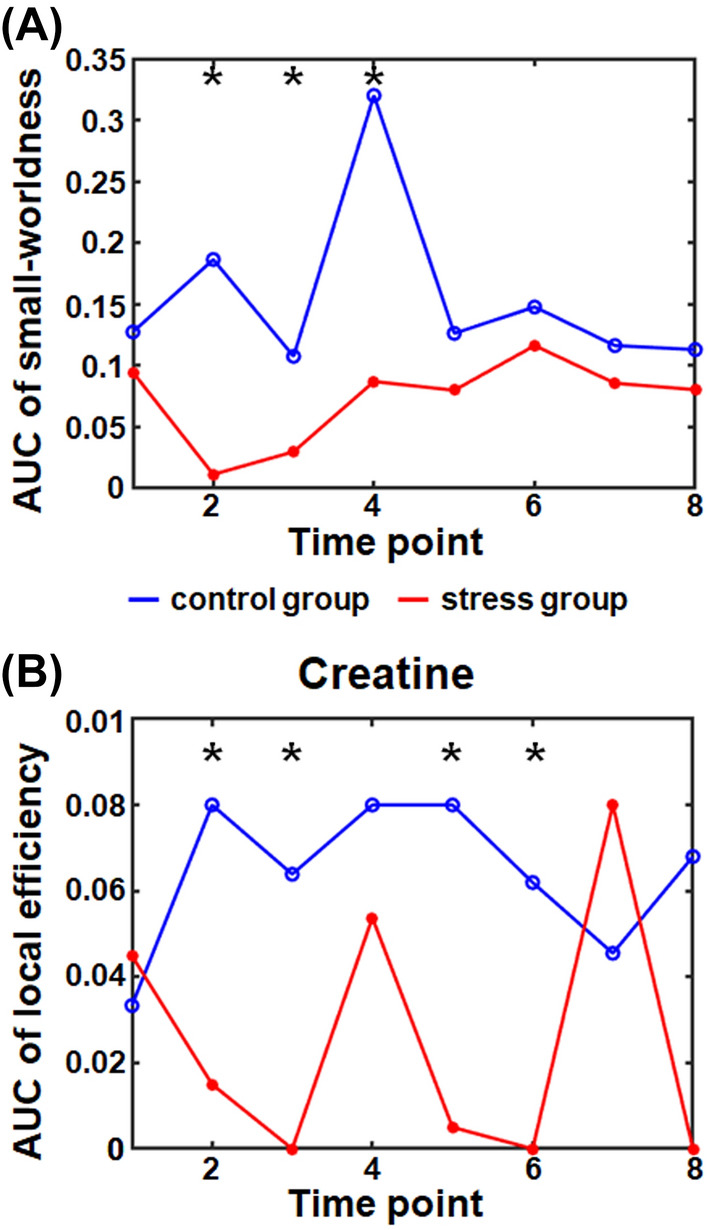
The area under the curve (AUC) of (A) the small-worldness and (B) the local efficiency of creatine in the metabolic network. The graph shows the small-worldness and local efficiency in creatine in the control (blue) and stress (red) group as a function of time. The asterisk indicates a significant difference in the AUC of the small-worldness or local efficiency of creatine (p-value < 0.05, corrected for the false discovery rate).
