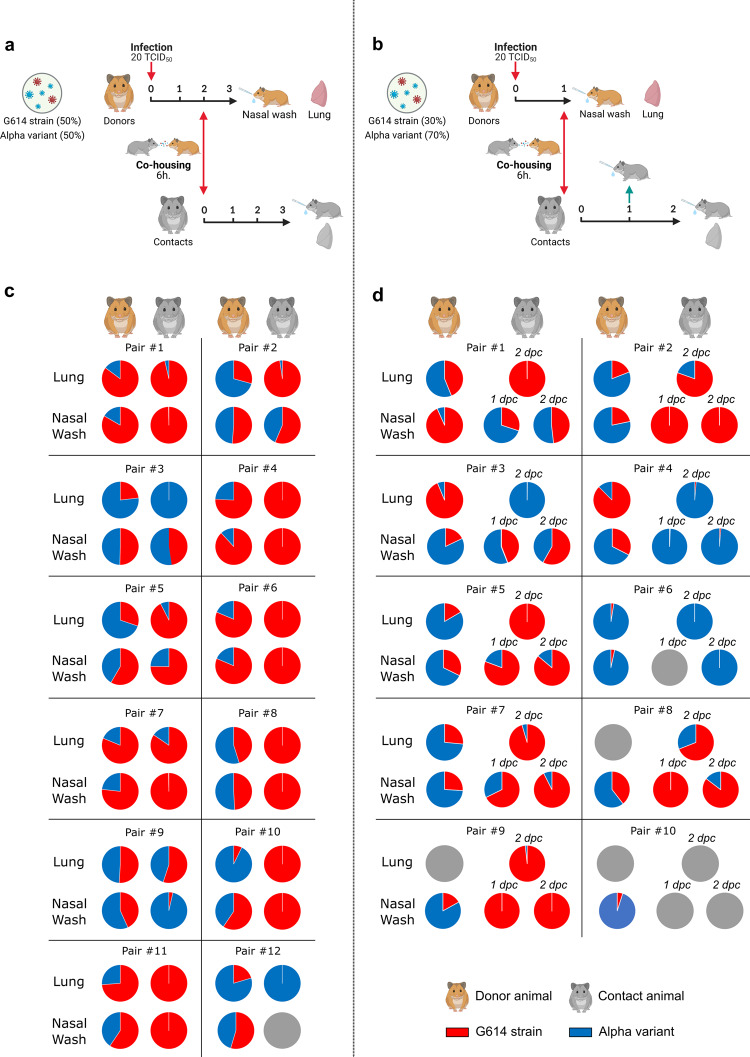
Fig. 2. Transmissibility assessment.
a and b Experimental timelines. a A group of 12 hamsters, named ‘donors’, was intranasally infected with an equal proportion of each viral strain for competition experiment (total: 20 TCID50). At 2 dpi, each donor was co-housed with a contact animal during a period of 6 h. Donors and contacts were sacrificed at 3 dpi and at 3 dpc, respectively. b A group of 10 hamsters, named donors, was intranasally infected with a mix (6:14) of G614 strain and Alpha variant for competition experiment (total: 20 TCID50). At 1 dpi, each donor was co-housed with a contact animal during a period of 6 h. Donors and contacts were sacrificed at 1 dpi and at 2 dpc, respectively. c and d Graphical representation of the proportion of each virus found in lungs and nasal washes for each pair of animals in transmission experimentations with 1:1 (c) and 6:14 ratios (d). Two specific RT-qPCR assays were used to measure the quantity of each virus. Gray circles mean that no viral RNA was detected in these nasal washes and lungs.

