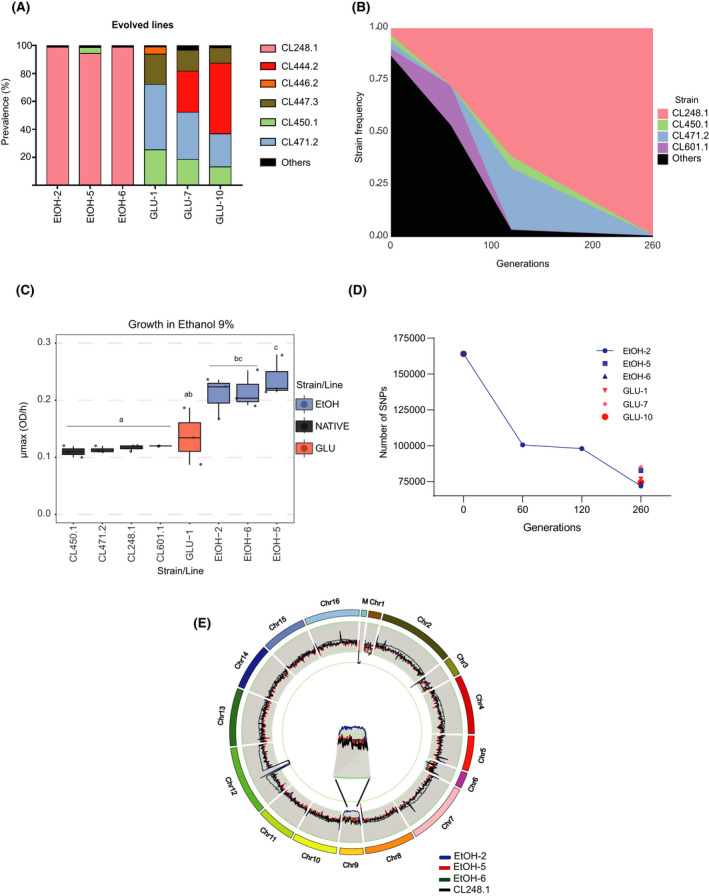
Fig. 2.

Genomic and phenotypic changes in the propagated lines.
A. The presence of the prevalent genetic backgrounds in three glucose (GLU) and ethanol (EtOH) propagated lines.
B. Prevalence (frequency) of the most prominent genetic backgrounds during the evolution of line EtOH‐2.
C. Ethanol 9% growth rates for the most representative parental strains and propagated lines.
D. Total number of SNPs relative to the CBS12357 reference genome at the beginning and end of the evolution assay for EtOH‐‐5, EtOH‐6 and GLU‐1, GLU‐7 and GLU‐10 lines. In addition, the number of SNPs during the evolution assay is shown for EtOH‐2.
E. Chromosome number estimation across EtOH lines. Only the EtOH‐2 line showed an aneuploidy by the end of the evolution assay (chromosome 9).
