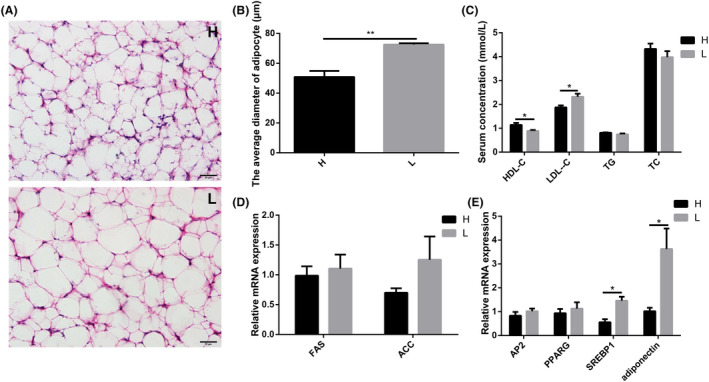
Fig. 4.

Different fat metabolism levels in blood and abdominal adipose tissue.
A. Chickens (Turpan cockfighting × White Leghorn) at 7th week of age were sacrificed to analyse fat metabolism level in blood and abdominal adipose tissue (n = 10). Each group contained five male and five female chickens. Different adipocyte structure by H & E staining.
B. The average diameter of adipocyte.
C. Different blood biochemical parameters related to lipid metabolism.
D. The relative mRNA expression of fat anabolism‐related genes in abdominal adipose tissue (qPCR).
E. The relative mRNA expression of adipocyte differentiation‐related genes in abdominal adipose tissue (qPCR). Scale bars = 50 μm. All data were presented as the means ± SEM. P values were calculated using Student’s t‐test, *P < 0.05, **P < 0.01.
