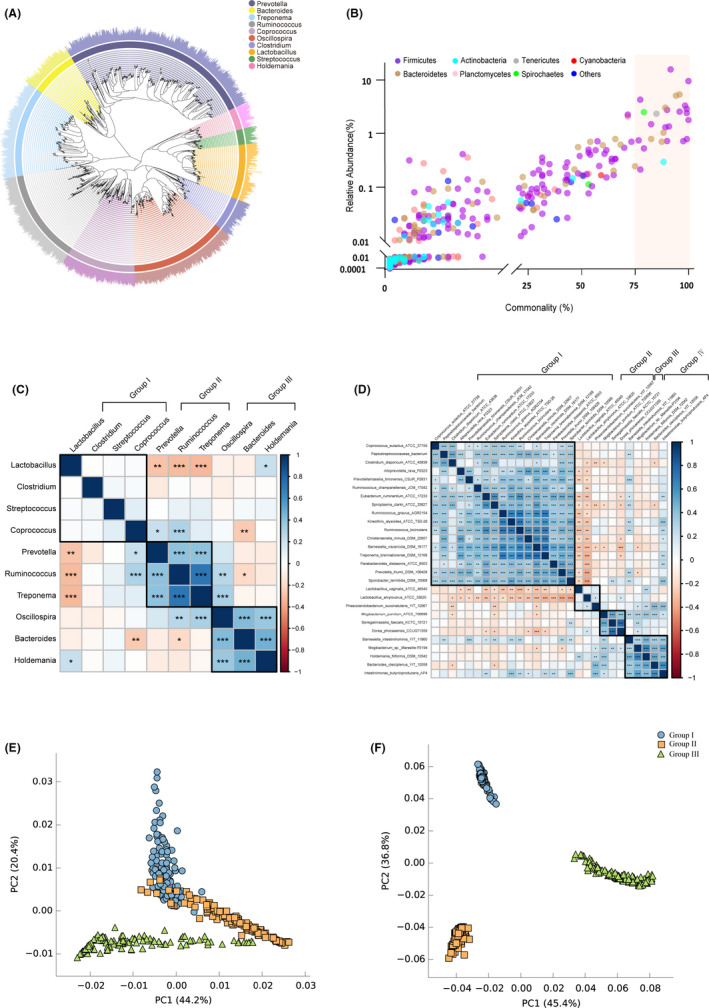
Fig. 2.

Pan and core gut microbiota of swine, correlations and metagenomic functions.
A. Phylogenetic tree of the top 10 most abundant genera.
B. Scatter plot of commonly identified microbes at species level. Commonality = number of observed samples/total samples. The colours of circles indicate the species from distinct bacterial phyla.
C. The correlation of top 10 abundance pan microbiota by Pearson’s rank.
D. The correlation of 28 core microbiota by Pearson’s rank. The black box in heat map plots represents the cluster of gut microbiota by ward method. Significant correlation is represented by ***: P < 0.001, **: 0.001 < P < 0.01 and *: 0.01 < P < 0.05 respectively.
E. PCA plot of predicted enzymes of pan microbiota based on Enzyme Commission numbers.
F. PCA plot of predicted pathways of pan microbiota based on KEGG.
