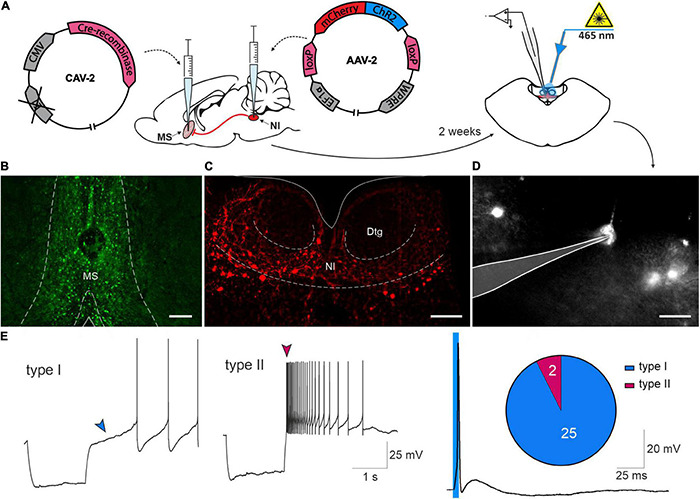
FIGURE 5.

Electrophysiological characterization of nucleus incertus neurons innervating the medial septum. (A) Experimental procedure. (B) Representative image of an MS injection site, illustrating Cre recombinase expression (green). Scale bar: 200 μm. (C) Representative image of NI illustrating mCherry protein expression in the NI region (red). Scale bar: 200 μm. (D) Image of NI neuron expressing mCherry protein recorded ex vivo, with the recording pipette outlined. Scale bar: 30 μm. (E) Representative traces of a current clamp recording demonstrating the delayed return to the baseline activity (blue arrowhead), characteristic of type I NI neurons (left) and the characteristic rebound depolarization (dark pink arrowhead) of type II NI neurons (middle), in response to a hyperpolarizing current pulse. Action potential recorded in NI neuron expressing mCherry, evoked in response to a light pulse (465 nm, 5 ms, blue line) (right), and pie chart of the number of type I (blue) and type II (dark pink) neurons innervating MS. MS, medial septum; NI, nucleus incertus.
