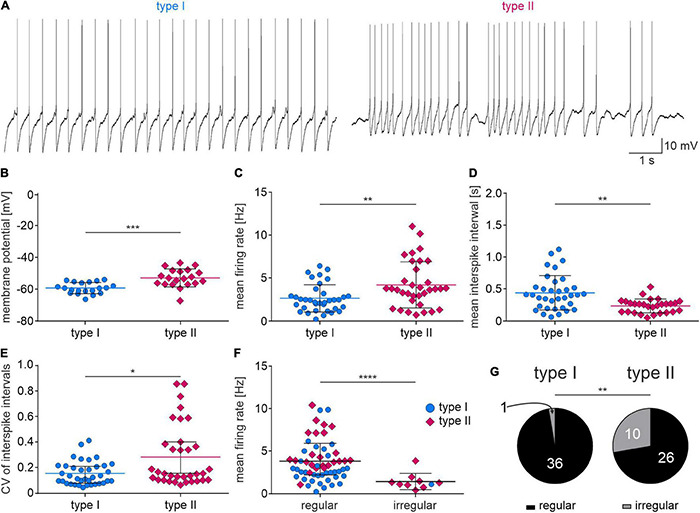
FIGURE 6.

Spontaneous activity of type I and II NI neurons. (A) Exemplary zero current-clamp trace recording of type I (left) and type II (right) NI neurons’ spontaneous activity. (B–F) Strip charts representing differences in active properties between type I and II NI neurons. Lines and whiskers represent mean and SDs (B,D), or median and interquartile range (C,E,F). *(p < 0.1), **(p < 0.01), ***(p < 0.001), ****(p < 0.0001), unpaired t-test in (B,D), unpaired Mann-Whitney test in (C,E,F). (G) Proportions of regular and irregular firing type I NI neurons (left) and type II NI neurons (right), **(p = 0.0031, Fisher’s exact test).
