FIGURE 7.

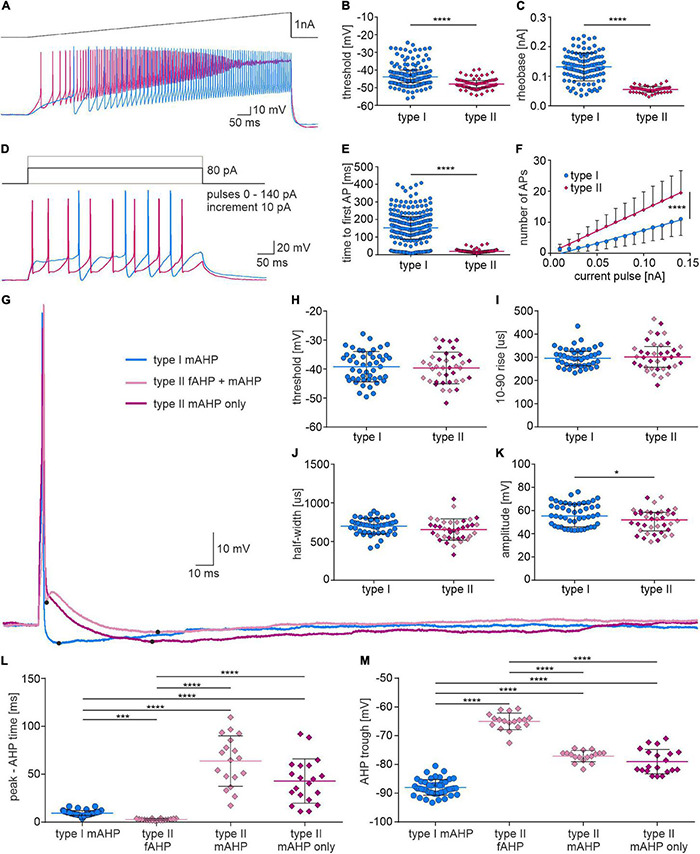
Firing properties and single action potential shape of type I and II NI neurons. (A) Current clamp protocol (upper trace) and voltage response (lower trace) of type I (blue) and type II (pink) NI neurons to applied current. (B) Action potential threshold, and (C) rheobase calculated from voltage responses shown in (A), ****[p < 0.0001, unpaired Mann-Whitney test in (B), unpaired t-test, in (C)]. (D) Current clamp protocol (upper trace) and voltage response of type I (blue) and type II (pink) NI neurons to depolarizing current pulse (+80 pA). (E) Time to first AP (p < 0.0001, unpaired Mann-Whitney test), and (F) number of action potentials of type I and type II NI neurons vs. the intensity of injected current, calculated from the voltage responses shown in (D). The slopes of the regression lines fitted to the experimental data represents the gain, which differed significantly between groups, ****(p < 0.0001, comparison of regression lines slopes). (G) Action potentials of type I and II NI neurons evoked by a single depolarizing current pulse, and (H–M) their properties. Note two different AP waveforms were recorded from type II NI neurons (with single mAHP and with fAHP and mAHP). *(p = 0.02, unpaired Mann-Whitney test). (L) AP peak to AHP trough time, and (M) AHP trough in APs of type I neurons (type I mAHP), in APs of type II neurons with fAHP and mAHP (type II fAHP and type II mAHP) and in APs of type II neurons with single mAHP (type II mAHP), ***(p ≤ 0.001), ****(p ≤ 0.0001), Kruskal-Wallis test in (L) and one-way ANOVA in (M). AHP, afterhyperpolarization; AP, action potential; fAHP, fast afterhyperpolarization; mAHP, medium afterhyperpolarization.
