FIGURE 8.

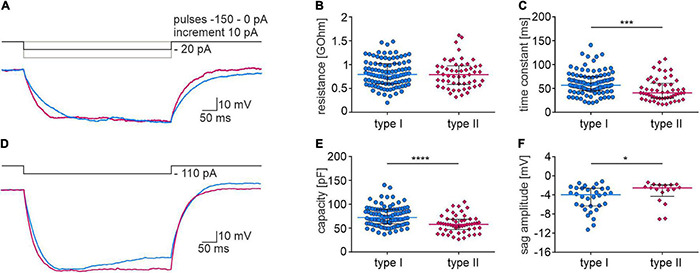
Membrane properties of type I and II NI neurons. (A) Current clamp protocol (upper trace) and voltage response (lower trace) of type I (blue) and type II (pink) NI neurons to applied hyperpolarizing current pulse (–20 pA). (B) Membrane resistance, and (C) time constant of type I and type II NI neurons, *** (p = 0.0002, unpaired Mann-Whitney test). (D) Current clamp protocol (upper trace) and voltage response (lower trace) of type I (blue) and type II (pink) NI neurons to applied hyperpolarizing current pulse (–110 pA). (E) Membrane capacity of type I and type II neurons calculated based on the resistance and time constant measured from voltage response to –20 pA current pulse, ****(p < 0.0001, unpaired Mann-Whitney test). (F) Voltage sag amplitude of type I and II neurons calculated from the voltage response to the current protocol shown in (D), *(p = 0.038, unpaired Mann-Whitney test).
