FIGURE 9.

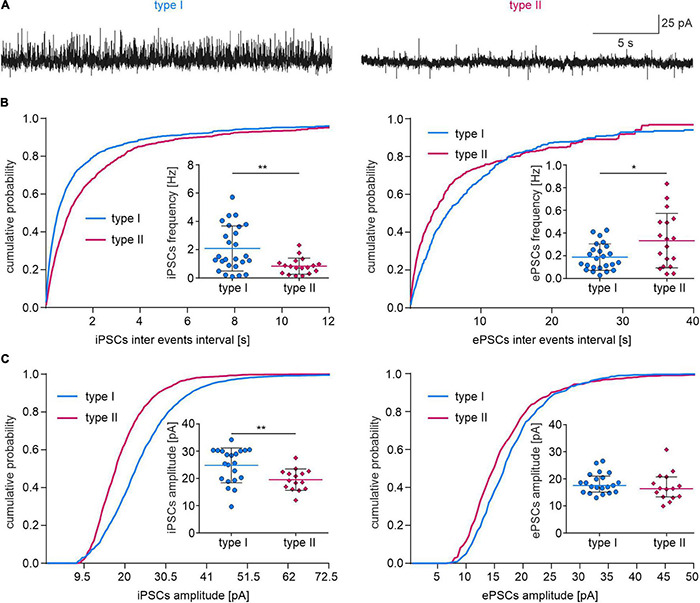
Synaptic inputs to type I and II NI neurons. (A) Exemplary traces of voltage clamp recordings (holding potential –50 mV) illustrating spontaneous inhibitory (upward deflections) and excitatory (downward deflections) postsynaptic currents in type I and type II NI neurons. (B) Cumulative frequency distribution histograms of the inhibitory (left) and excitatory (right) PSC inter-event intervals (bin size = 20 ms). Insets, comparisons of PSCs frequencies *(p = 0.014), **(p = 0.003), unpaired t-tests. (C) Cumulative frequency distribution histograms of sIPSC and sEPSC amplitudes (bin = 1 pA). Insets, comparisons of PSC amplitudes, **(p = 0.008, unpaired t-test). ePSC, excitatory postsynaptic current; iPSC, inhibitory postsynaptic current.
