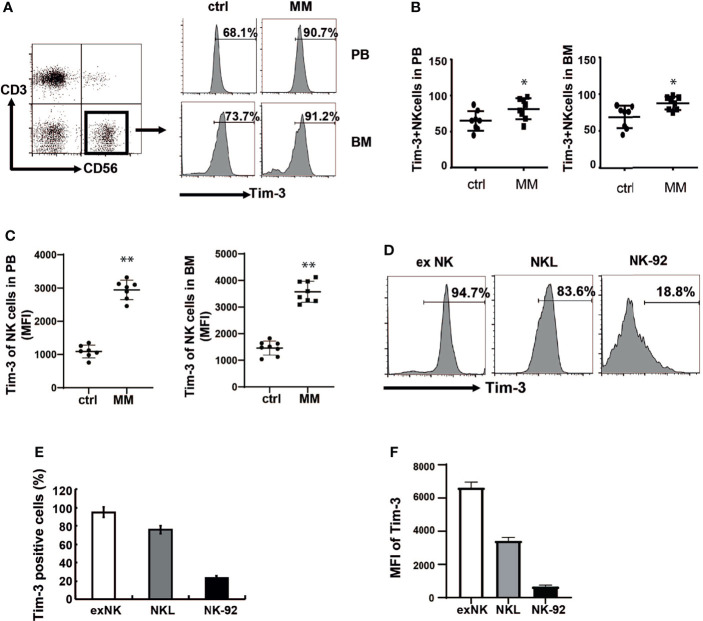
Figure 1.
Tim-3 expression in primary NK cells and NK cell lines. Tim-3 expression was quantified by flow cytometry. (A) Tim-3 expression in the BM and peripheral blood NK cells of MM patients and control donors. Freshly isolated hPBMCs and hBMMCs were stained with CD3, CD56, Tim-3, and analyzed for the proportion of Tim-3+NK cells. (B, C) Statistical analysis of the proportion of Tim-3+NK cells and the MFI of Tim-3 in NK cells (n=8). (D–F) The expression of Tim-3 in exNK, NKL and NK-92 cells. One representative results from at least three independent experiments were presented. Data shown were mean ± SD of at least three independent experiments. *P < 0.05, **P < 0.01 versus control NK cells.

