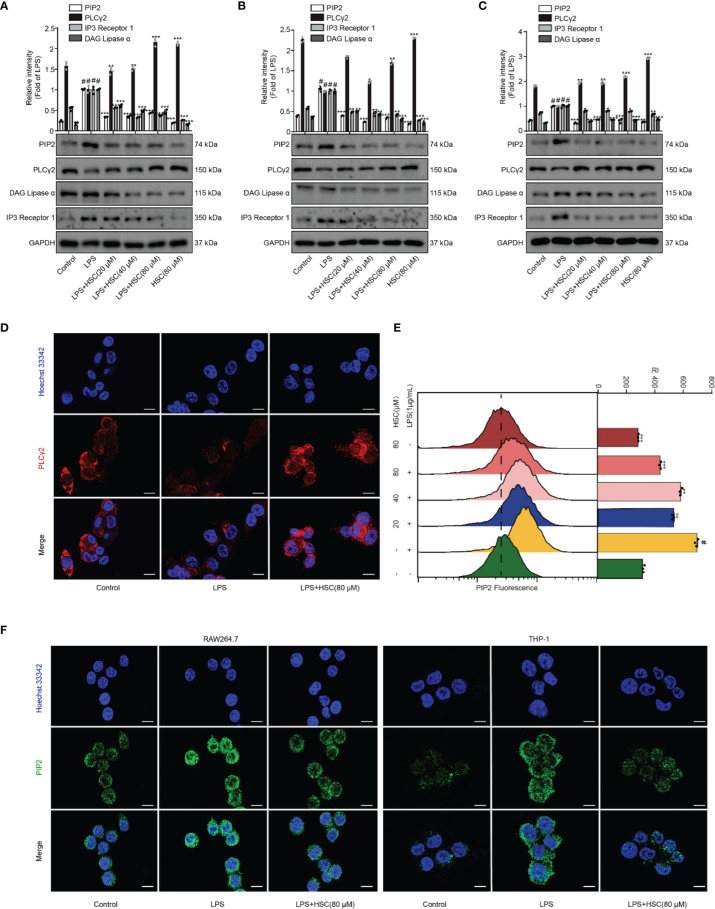
Figure 5.
Effect of HSC on the PIP2 signaling pathway. (A) RAW264.7, J774A.1, THP-1 cells treated with HSC for 4 h, and then induced by LPS (1 μg/ml) for 1 h; (A, B, and C) The expression of PIP2, PLCγ2, DAG, and IP3 were detected by western blotting in RAW264.7 (A), J774A.1 (B), THP-1 (C) cells; (D) The PLCγ2 expression was detected by immunofluorescence assay in RAW264.7 cells; (E) Detection of PIP2 expression in RAW264.7 cells by flow cytometry; (F) Detection of PIP2 expression by immunofluorescence in RAW264.7 and THP-1 cells (Scale bar=20 μm); # P < 0.001 compared to control alone group; * P < 0.05, ** P < 0.01, and *** P < 0.001, versus the LPS group, (n=3).

