Figure 10.
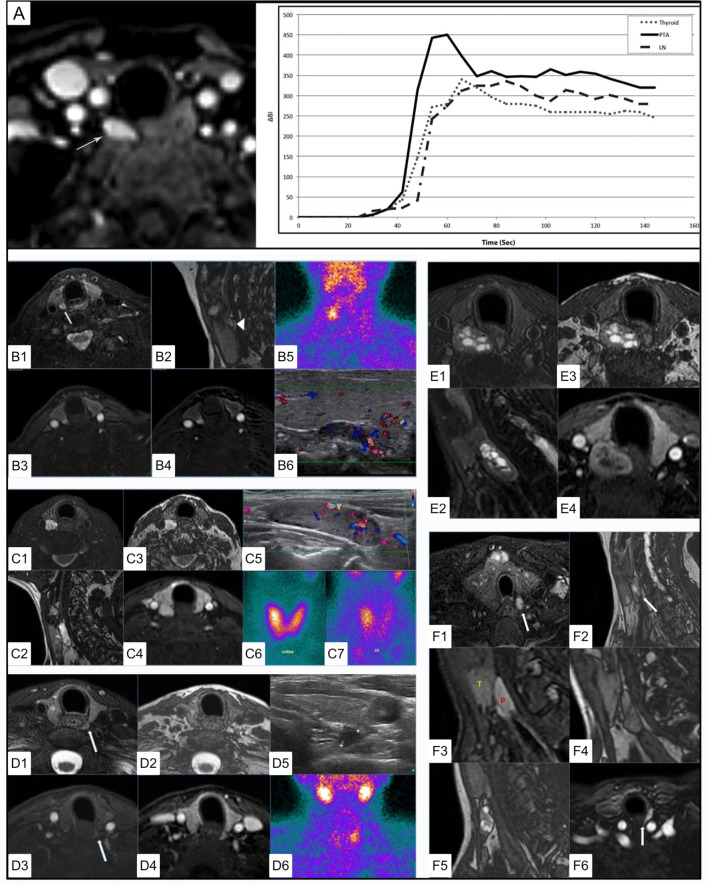
4DMRI imaging of parathyroid adenomas. (A) Axial arterial phase post contrast fat saturation T1 MRI of PA at the tracheoesophageal groove (white arrow) in a 47 yo F with primary hyperparathyroidism (PTH - 164 pg/mL, Ca2+ = 10.8). Graph depicts contrast-time curve analysis from ROI placed over the PA (solid), a lymph node (dashed), and the thyroid (dotted), showing relative faster time to peak (TTP), increased wash in and increased wash out values from the PA. (B) 4DMRI of PA posterior to the right thyroid mildly hyperintense relative to the thyroid on axial T2 fat saturation [(B1), white arrow] and separated by cleavage plane on sagittal out of phase imaging [(B2, white arrow] images with avid arterial enhancement greater than thyroid on T1 post contrast (B3) and T1 post contrast subtraction imaging (B4) and comparative coronal 99mTc-sestamibi (B5) and ultrasound imaging (B6). (C) 4DMRI of PA posterior to the right thyroid gland with marked relative T2 fat saturation hyperintensity (C1), oblong appearance without reliable cleavage plane on out of phase imaging in sagittal (C2) or axial (C3) planes, and arterial enhancement similar to the thyroid gland (C4) and associated ultrasound (C5) and early (C6) and delayed (C7) phase 99mTc-sestamibi. (D) Dynamic MRI of PA posterior to the left thyroid slightly hyperintense similar to thyroid on axial T2 (D1), with thin cleavage plane on axial out of phase (D2), with mild enhancement on early axial T1 post-contrast subtraction (D3) and similar to the thyroid gland on delayed axial T1 post-contrast subtraction (D4) and comparative ultrasound (D5) and coronal 99mTc-sestamibi (D6). (E) 4DMRI of PA posterior to the right thyroid with mixed cystic and solid components causing mass effect on the esophagus displacing it to the left on axial (E1) and oblong appearance on sagittal (E2) T2 fat saturation, with cleavage plane on axial out of phase (E3), and partial enhancement similar to the thyroid gland on T1 post-contrast fat saturation (E4). (F) Summary of MRI features of PA including T2 fat saturation hyperintensity (F1), oblong appearance (F2), cleavage plane between the thyroid and PA (F3), which can be emphasized by india ink artifact on out of phase imaging (F4), ‘marbled’ appearance (F5), fast and strong enhancement on T1 post-contrast (F6). Reproduced with permission from: (A) Nael K, Hur J, Bauer A, Khan R, Sepandari A, Inampudi R, et al. Dynamic 4D MRI for Characterization of Parathyroid Adenomas: Multiparametric Analysis. AJNR Am J Neuroradiol. 2015;36: 2147–2152. doi:10.3174/ajnr.A4425 (B–F) Sacconi B, Argirò R, Diacinti D, et al. MR appearance of parathyroid adenomas at 3 T in patients with primary hyperparathyroidism: what radiologists need to know for pre-operative localization. European Radiology. 2016 Mar;26(3):664-673. DOI: 10.1007/s00330-015-3854-5.

