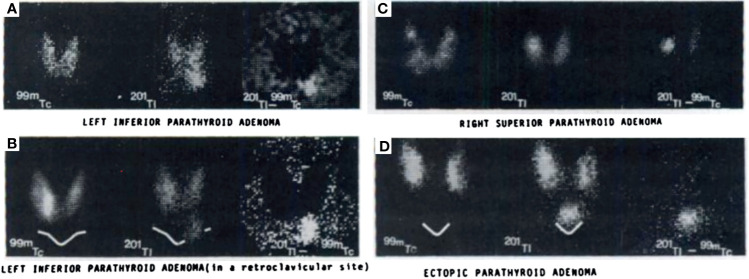
Figure 3.
Early examples of parathyroid pathology detection using 99mTc-pertechnetate and thallium subtraction scintigraphy. Upper left panel (A) depicts 99mTc-pertechnetate thyroid uptake on the left image, 201Tl uptake in the middle image, and the subtraction image highlighting a left inferior parathyroid adenoma on the right image. Lower left panel (B) depicts a similar 201Tl minus 99mTc-pertechnetate series of three images of a left inferior parathyroid adenoma with decreased signal to noise ratio due to its location behind the clavicle contributing to increased attenuation relative to the series above. Right upper panel (C) depicts a similar subtraction series of a right superior parathyroid adenoma. Right lower panel (D) depicts a subtraction series of an ectopic parathyroid adenoma near the sternal notch. Reproduced with permission from: Ferlin G, Borsato N, Camerani M, Conte N, Zotti D. New perspectives in localizing enlarged parathyroids by technetium-thallium subtraction scan. J Nucl Med. 1983 May;24(5):438-41. PMID: 6842292.

