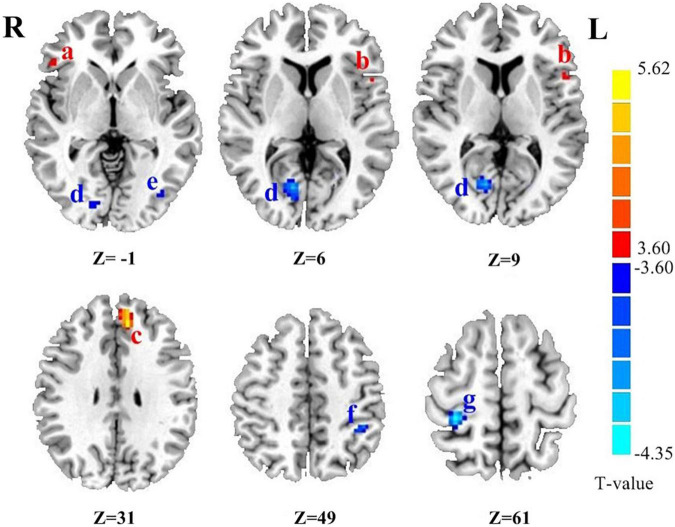
FIGURE 1.
The brain regions with abnormal DC value in PD patients. (a) Right inferior frontal gyrus. (b) Left precentral gyrus. (c) Left medial frontal gyrus. (d) Right occipital lobe. (e) Left inferior temporal lobe gyrus. (f) Left inferior parietal lobule. (g) Right postcentral gyrus. Z is the coordinates of the Montreal Neurological Institute. The color scale indicates the magnitudes of T-values.

