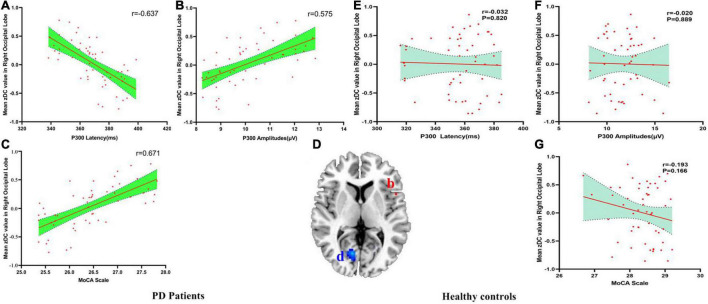
FIGURE 3.
(A–G) The correlation results between mean zDC value in right occipital lobe and P300 latency, P300 amplitudes and MoCA scale in PD patients and healthy controls. DC, Degree Centrality. The brain region in the red Alphabet b was left precentral gyrus. The brain region in the blue Alphabet d was right occipital lobe.

