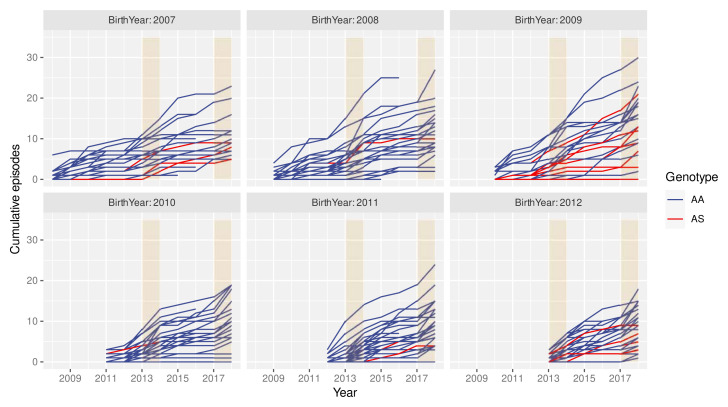
Figure 3. High variance in clinical episode histories.
Graphs showing individual children’s cumulative number of clinical malaria episodes over time, stratified by birth year. Red lines indicate children with the sickle cell trait (AS). Orange rectangles highlight high malaria transmission years (2014 and 2018).

