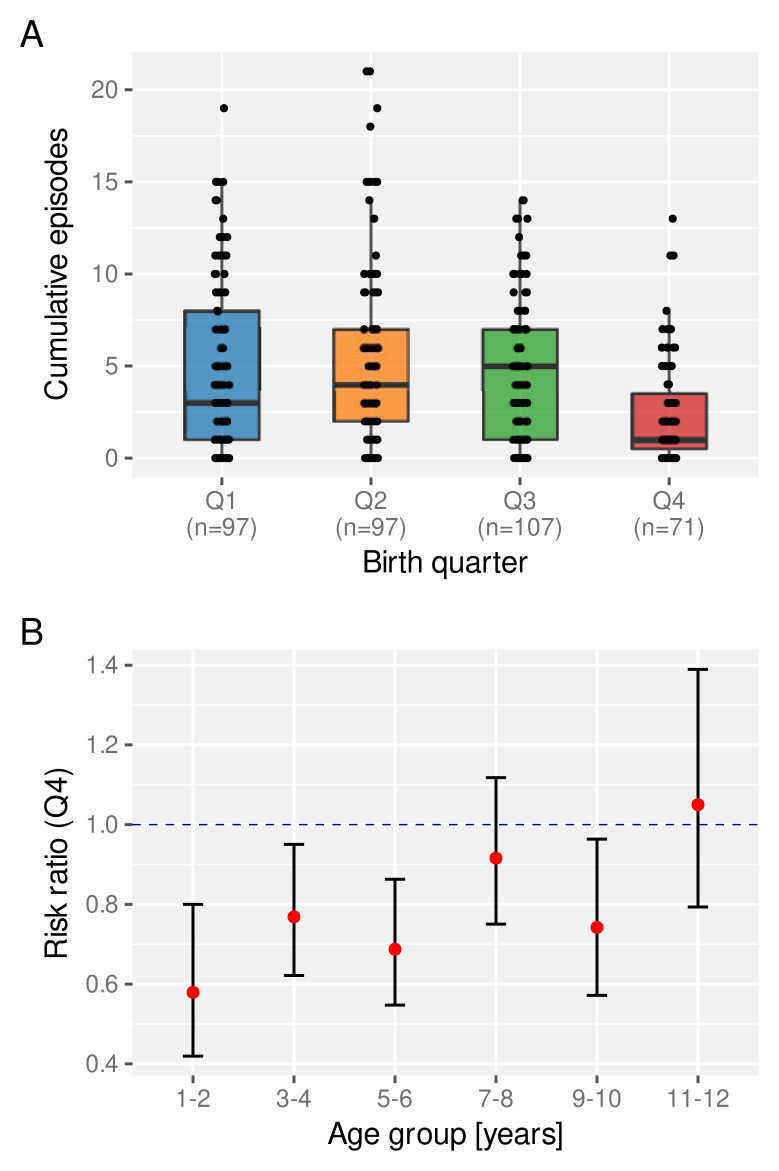
Figure 6. The effect of birth quarter on the risk of clinical malaria.
A. Distribution of the number of clinical episodes experienced by an individual child by the age of 6 years stratified by birth quarter. Box and whisker plots indicate the median and inter quartile ranges. B. Risk ratio of experiencing a clinical episode in a given year between children born in Q4 compared to those born between Q1 and Q3.

