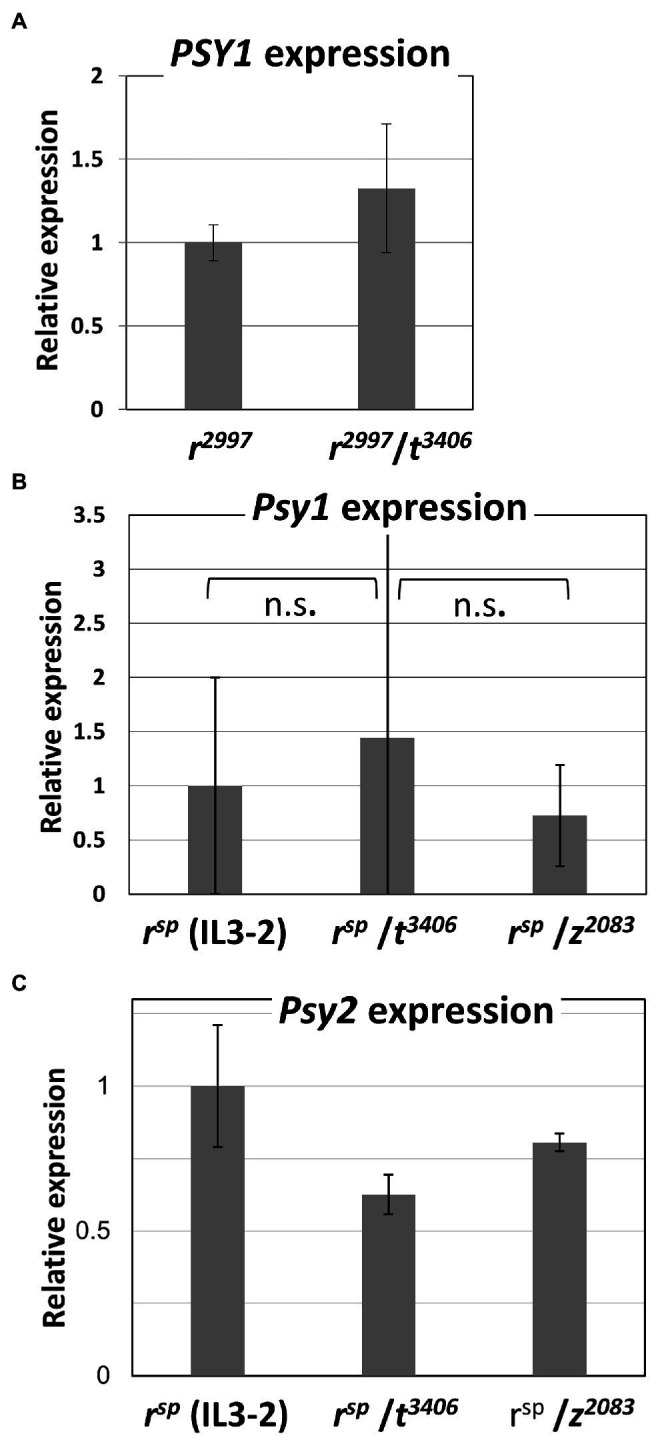
Figure 3.

Expression of PSY genes in fruits. (A) PSY1 transcript levels at the “breaker” stage of r2997 and r2997/t3406; (B) PSY1 transcript levels at the “breaker” stage of rsp, rsp/t3406 and rsp (introgression line IL3-2)/zs2083; (C) PSY2 transcript levels in rsp, rsp/t3406 and rsp/z2083. The data were compared using the “Compare all pairs” (Tukey–Kramer), p < 0.05. n.s. no significance.
