Figure 1.
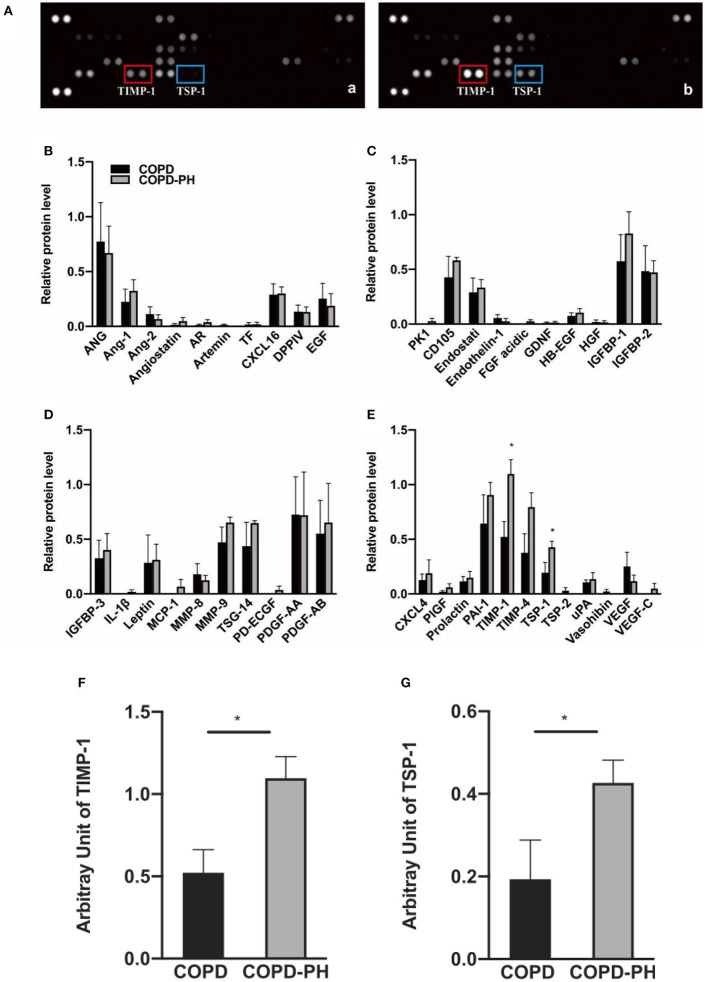
Angiogenesis array data. (A) Representative image of angiogenesis array of the plasma from COPD patients without PH [COPD, (a)] and with PH [COPD-PH, (b)] array blots. The levels of angiogenic factors are determined based on their blotting intensity in duplicates. (B–E) Relative protein level of for angiogenesis-associated protein determined by angiogenesis assay (Data were normalized to three pairs of reference spots). (F,G) Based on two-sample independent Student's t-test analysis, TIMP-1 and TSP-1 were significantly higher in COPD-PH than COPD group. Data were present as mean ± SEM (n = 4). *P < 0.05 vs. COPD group.

