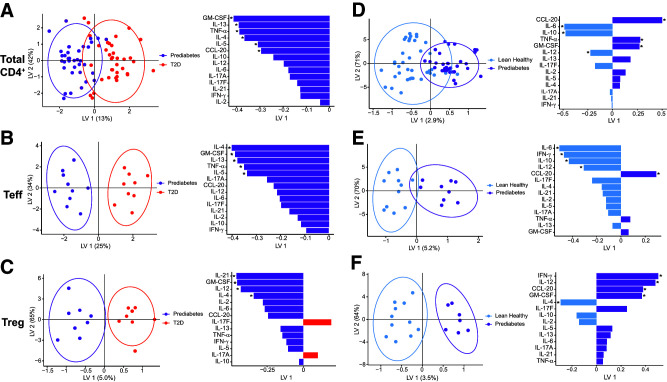
Figure 1.
CD4+ T cells from subjects with prediabetes produce a unique cytokine profile. PLSDA of cytokines in supernatants of total CD4+ T cells (A and D), purified Teff (B and E ), or purified Treg (C and F ) stimulated for 40 h with CD3/CD28 Dynabeads. Comparisons are between profiles generated by cells from subjects with prediabetes versus with type 2 diabetes (T2D) (A–C) or subjects with prediabetes and versus lean/healthy (normoglycemic) subjects (D–F). Left panels show distribution of a combination of all cytokines measured, with each dot representing compendium outcomes (“inflammation”) from one sample. Right panels rank cytokines for importance (top = more important; bottom = less important) in differentiating combinatorial inflammatory profiles from the groups indicated, with color fill indicating the clinical group whose cells produced more of that cytokine. *Statistical differences (P < 0.05) in post hoc analysis of ranked cytokines. N = 11, 9, or 9 subjects for lean, prediabetes, or type 2 diabetes, respectively. For analyses in panels A and D we included cytokine profiles from Teff, Treg, and 5% and 20% Treg-Teff cocultures (see Figs. 2 and 3) that together represent a naturally achievable range of Treg-to-Teff ratios and thus total CD4+ T cell inflammation. Each dot is a two-dimensional representation of a multidimensional combination of all cytokines generated from the indicated type of sample(s). Linear combinations of cytokines were visualized as reduced dimensional latent variables (LVs).

