Figure 5.
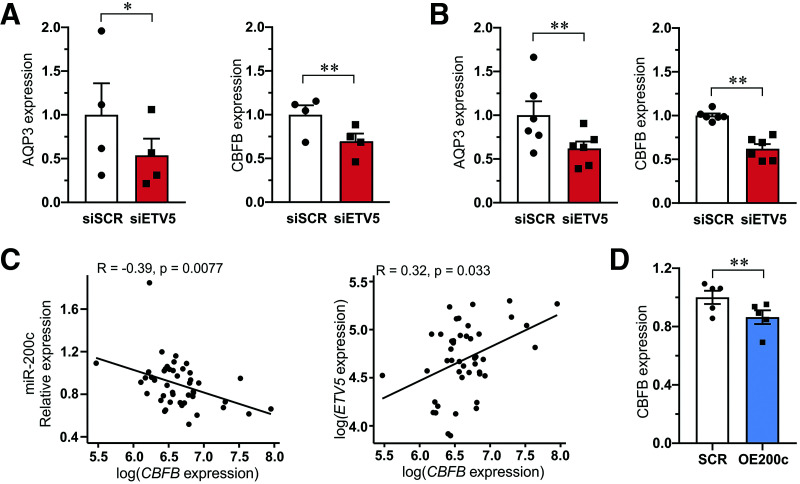
Validation of top genes regulated by ETV5 and the correlation of CBFB with miR-200c. A and B: Expression of AQP3 and CBFB in siSCR and siETV5 human islets (A) and EndoC-βH1 β-cells (B). Data in A and B are presented as mean ± SEM of four to six experiments. *P < 0.05 and **P < 0.01 siSCR vs. siETV5 with paired Student t test. C: Pearson correlation between miR-200c and CBFB expression in islets from 47 human donors (left) and between ETV5 and CBFB expression in the same donors (right). D: Expression of CFBC in EndoC-βH1 β-cells after transfection with control scramble (SCR) and pre–miR200c (OE200c). Data are presented as mean ± SEM of five biological replicates. **P < 0.01 SCR vs. OE200c using paired Student t test.

