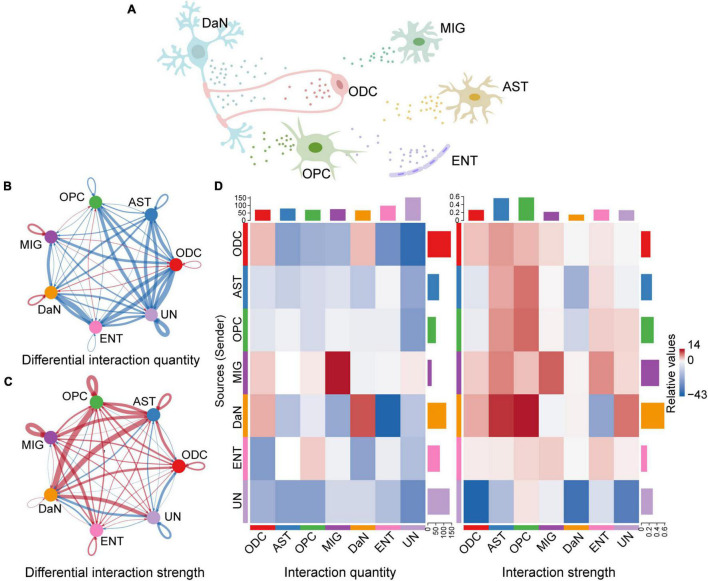
FIGURE 3.
Inference of cell–cell communications by CellChat shows global alterations in signaling pathways-mediated communications between DaN and non-neuronal cells in PD. (A) Schematic diagram of cell–cell communication between DaN and non-neuronal cells. Circle plots of the interaction quantity (B) and interaction strength (C) between DaN and non-neuronal cells. Blue lines indicate that the displayed communication is decreased in PD, whereas red lines indicate that the displayed communication is increased in PD compared with healthy control. (D) Heatmaps of the interaction quantity (left panel) and interaction strength (right panel) between DaN and non-neuronal cells. Blue color indicates that the displayed communication is decreased in PD, while red color indicates that the displayed communication is increased in PD compared with healthy control.

