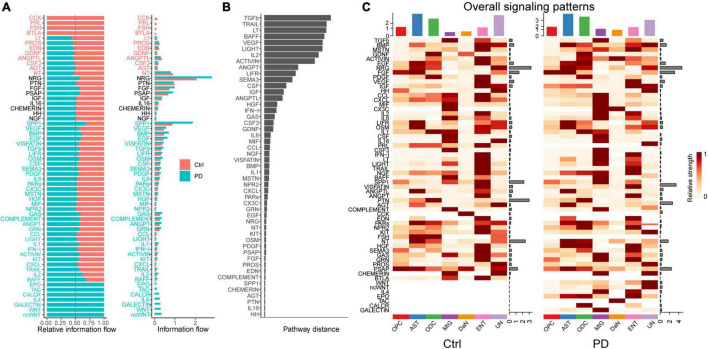
FIGURE 4.
Cell–cell communications mediated by individual signaling pathways are altered in PD between DaN and non-neuronal cells. (A) Bar plots of the ranking of signaling axes by overall information flow differences in the interaction networks between control (Ctrl) and PD sample. The top signaling pathways with red-colored labels are more enriched in the control sample, the middle ones with black-colored labels are equally enriched in control and PD sample, and the bottom ones with green-colored labels are more enriched in the PD sample. (B) Bar plot of the ranking of signaling axes between control and PD sample by pairwise Euclidean distance. (C) Heatmaps of the overall (comprising both outgoing and incoming) signaling flows of each cell population mediated by individual signaling axes in control and PD sample.

