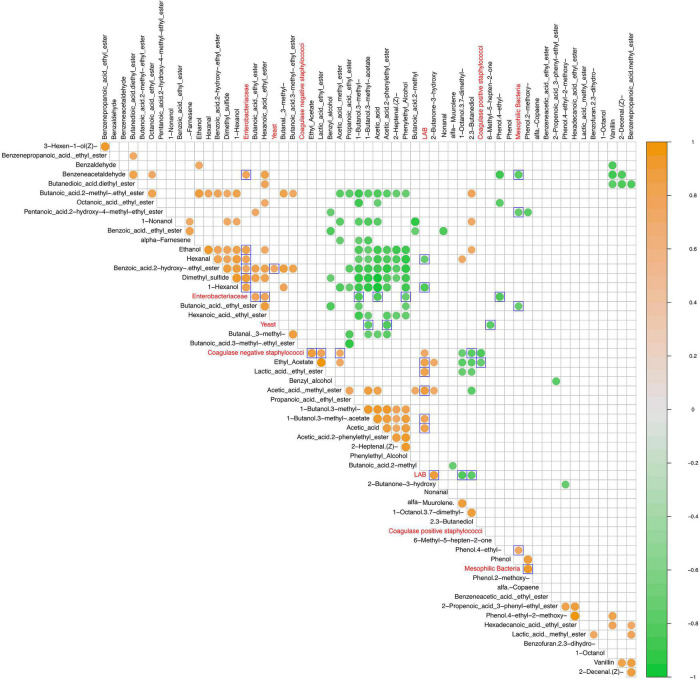
FIGURE 6.
Spearman correlation matrix between VOCs (black font characters) and microbial groups (red font characters) detected values after 15 and 80 days of fermentation in olive drupes. The normalized scaled matrices were merged and used for correlation computing. Only statistically significant correlations (p < 0.05) were plotted. The color graduated scale ranges from −1 (green: negative correlations) to 1 (orange: positive correlations). Blue delimited square marked the outgroup comparisons.

