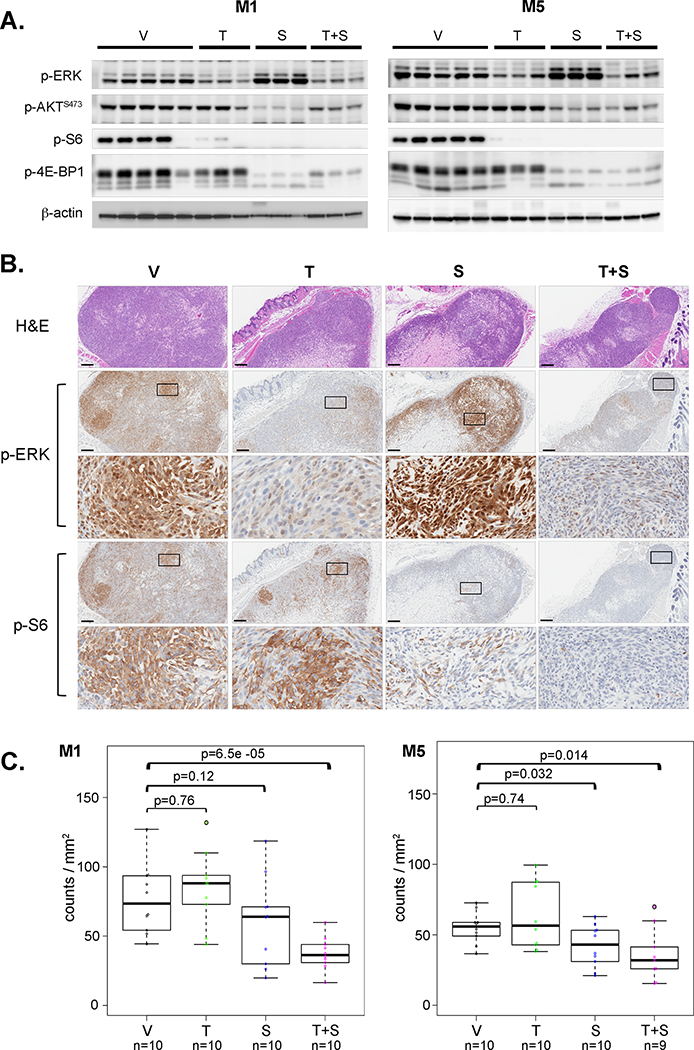
Figure 2.
Trametinib and sapanisertib target inhibition in vivo. Nude mice bearing subcutaneous M1 or M5 canine MM xenografts were treated daily with 5.0 mg/Kg trametinib and/or 2.0 mg/Kg sapanisertib to investigate target inhibition in vivo. A) Tumors were harvested and lysed after three daily doses of inhibitors trametinib (T), sapanisertib (S), the two-drug combination (T+S), or vehicle only control (V) for western blots of p-ERK, p-AKT, p-S6 and p-4E-BP1. B) Fixed tumor tissues were sectioned for H&E staining, and anti-p-ERK and p-S6 IHC was performed to independently assess affirmation of western blot results in the same mouse experiment as in A). Photomicrographs from M1 canine MM xenografts of treated mice, displayed at low and high magnification for IHC (scale bar=200 µm), are representative of five mice per group. Area of higher magnification location is shown as box in respective low magnification image. C) To assess the early responses to inhibitor action, anti-p-HH3 IHC was performed to investigate the proliferative activity of MM cells after three daily doses of inhibitor treatment. Two regions of interest were randomly selected for each tumor, five tumor tissues per treatment group. Anti-p-HH3 immunopositive cells were counted and the results were presented as positive cell number per tumor area. Median counts, solid line, with 1st and 3rd quartile ranges indicated in box plots. Wilcoxon signed-rank tests were used to compare the proliferation activities between treatment groups; p-values are indicated.

