Fig. 3.
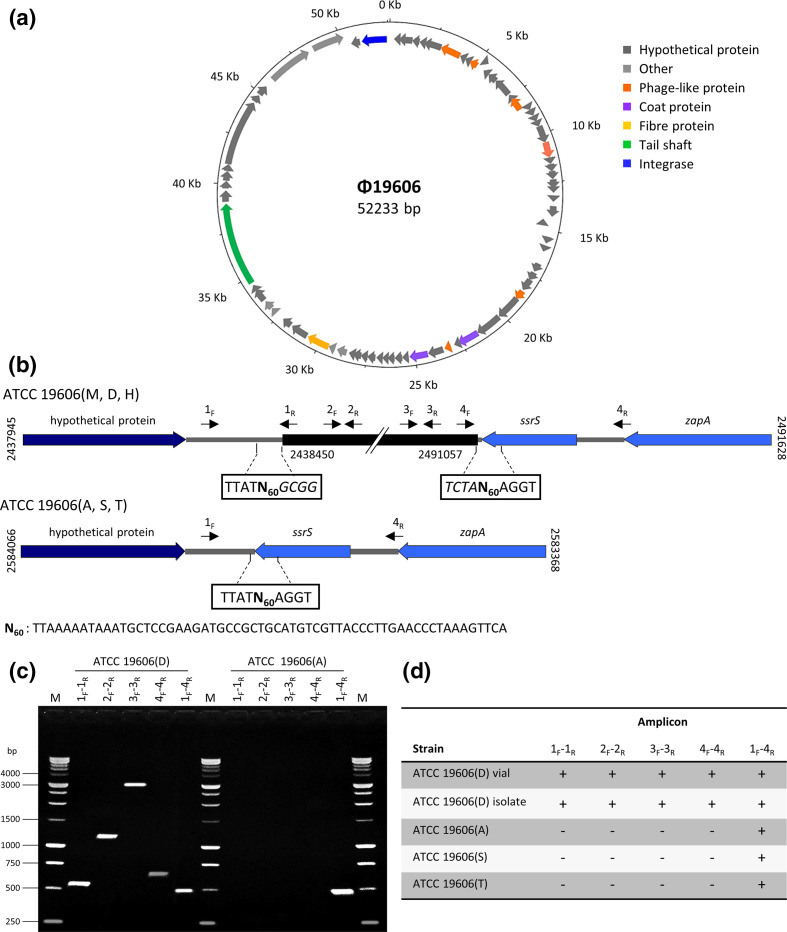
A. baumannii Φ19606 phage. (a) Circular map of the Φ19606 genome drawn with DNAPlotter. The genome map illustrates putative ORFs along with the direction of transcription indicated with arrows. Functional proteins predicted by PHASTER are depicted in different colours. (b) Integration site of Φ19606 (black) into the ATCC 19606(M, D, H) chromosomes (top). The double slash denotes a phage region that is not shown. Positions refer to the ATCC 19606(M) genome sequence. Structure of ATCC 19606(A, S, T) after phage loss (bottom). Positions refer to ATCC 19606(A) genome sequence. Sequences flanking the insertion site are boxed, with predicted phage nucleotides italicized. Primer positions are indicated with black arrows. N60 stands for the 60-nucleotide sequence generated by phage insertion/excision. (c) Agarose gel electrophoresis of the PCR products obtained by using different primer pairs indicated in (b). (d) Presence (+) or absence (-) of amplicons detected in the different A. baumannii ATCC 19606T strains.

