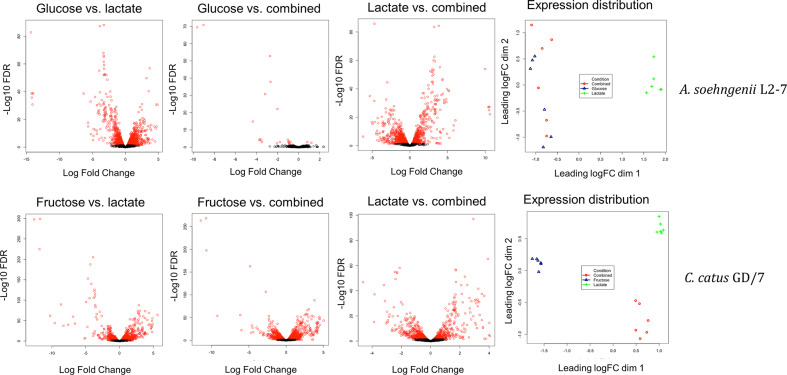
Fig. 3.
Volcano plots of log fold gene-expression change vs. –log10 of the false discovery rate (FDR) value and multidimensional scaling plots showing the gene-expression distribution of samples during growth on lactate, monosaccharide or a combination of the two. Genes with a significant FDR value <0.05 in the volcano plots are highlighted in red. A complementary numerical overview is given in Table S5. ‘Combined’ indicates cultures incubated with both lactate and hexose.

