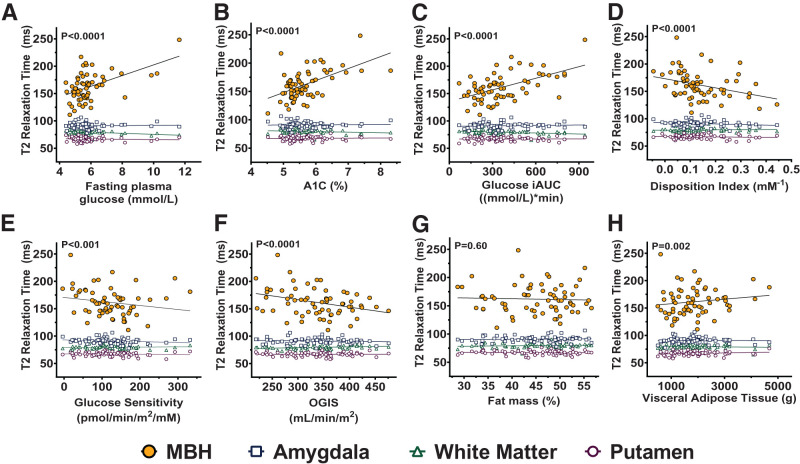
Figure 2.
Age-adjusted cross-sectional associations of T2 relaxation time with measures of glycemia, glucose tolerance, β-cell function, insulin sensitivity, and adiposity among all participants, stratified by brain region. Positive linear associations of MBH T2 relaxation time (filled gold circles) were present for fasting plasma glucose (A), hemoglobin A1c (B), and glucose iAUC (C). Negative linear associations were present with MBH T2 relaxation time and the disposition index (insulinogenic index * [1 / fasting insulin]) (D), glucose sensitivity (E), and OGIS index (F). MBH T2 relaxation time was not related to total body fat mass percentage (G) but was positively associated with VAT mass (H). There were no associations within any control regions (open symbols) for any measure. Generalized estimating equation models included outcome data from all brain regions, an interaction term (predictor * region), and a covariate for age (age-adjusted data shown). P values reported on graphs derived from model posttests of linear association for the MBH region. N = 67. Missing data include: fasting glucose, glucose iAUC, insulin iAUC, glucose sensitivity, OGIS (N = 2), VAT (N = 1).

