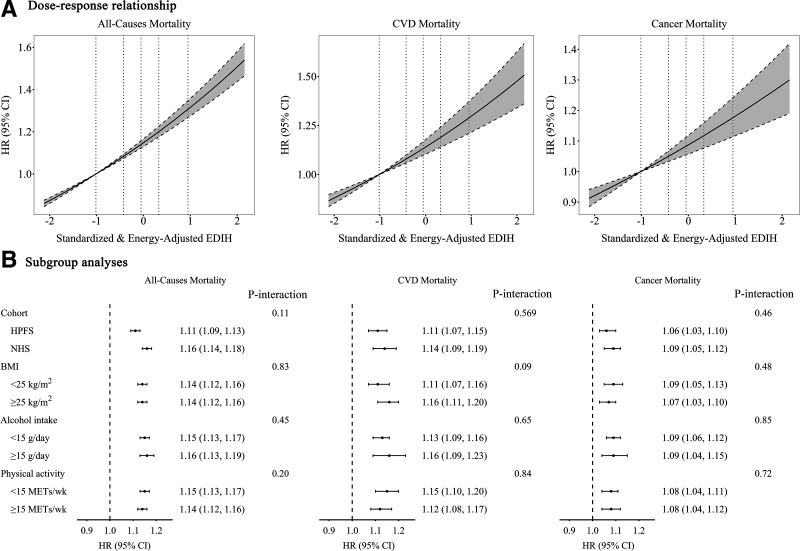
Figure 1.
Association of EDIH with all-cause and cause-specific mortality. A: The dose-response relationship is shown. Reference levels were set to the median EDIH values of the first quintile (−1.01). Vertical dotted lines indicate median values of each EDIH quintile (−1.01, −0.43, −0.05, 0.33, and 0.95). Solid lines indicate HRs, and dashed lines depict 95% CIs. No spline variables were selected in the analyses. All P for linearity <0.001. B: Subgroup analysis results are presented. All models in A and B were stratified by cohort, age, and calendar years, and were adjusted for race, smoking status, physical activity, current aspirin use, multivitamin use, family history of cancer, family history of diabetes, family history of myocardial infraction, baseline hypertension, baseline hypercholesterolemia, BMI, and menopausal status and postmenopausal hormone use for women.

