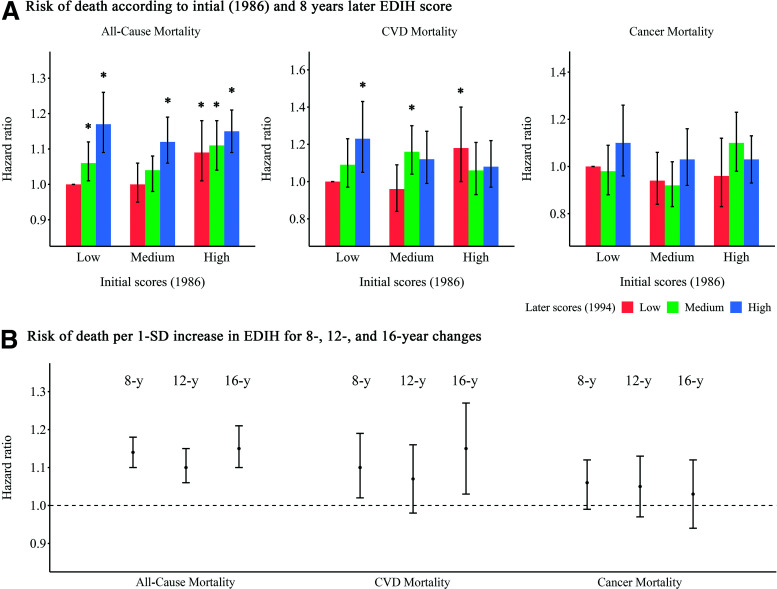
Figure 2.
HRs (95% CIs) for the association between changes in EDIH and risk of death. A: Risk of death is shown according to the initial EDIH score (1986) and the EDIH score 8 years later. Initial EDIH score are shown as low, medium, and high. At 8 years later, participants may have had a consistently low EDIH scores over time, a change from a low score to a medium or high score, a consistently medium score over time, a change from a medium score to a low or high score, a consistently high score over time, or a change from a high score to a low or medium score. The fully adjusted models were adjusted for the initial (1986) EDIH score, race, smoking status, initial and changes in physical activity, family history of myocardial infarction, diabetes, or cancer, baseline (1994) aspirin use, multivitamin use, and menopausal status and postmenopausal hormone use (NHS only), baseline hypertension or hypercholesterolemia, initial BMI, and weight changes. The error bars represent 95% CIs. *P < 0.05 for the associations of HRs compared with participants who had consistently low EDIH scores over time. B: Risk of death is shown per 1-SD increase in EDIH scores for preceding 8-, 12-, and 16-year changes. The fully adjusted HRs of death from any cause per 1-SD increase in EDIH for preceding 8, 12, and 16 years are shown. The error bars represent 95% CIs.

