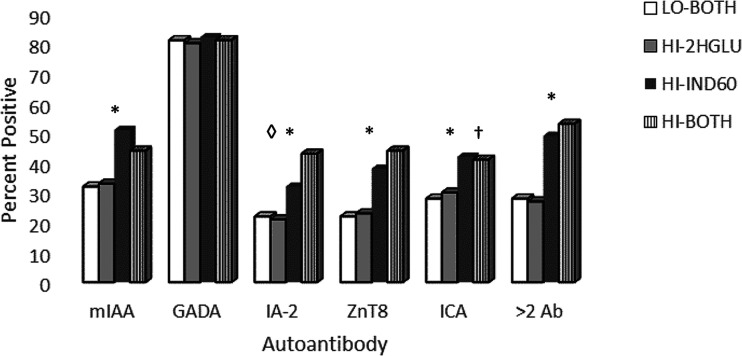
Figure 1.
Distribution of Ab and measures of C-peptide among groups. Note the consistent aggregation of HI-IND60 with HI-BOTH and of HI-2HGLU with LO-BOTH. *P < 0.01 for greater percentages of all Ab measures in HI-IND60 and HI-BOTH than in either HI-2HGLU or LO-BOTH. †P = 0.003 for greater percentage of ICA in HI-2HGLU than in HI-BOTH. ◊P < 0.003 for greater percentage of IA-2A in HI-BOTH than in HI-IND-60.

