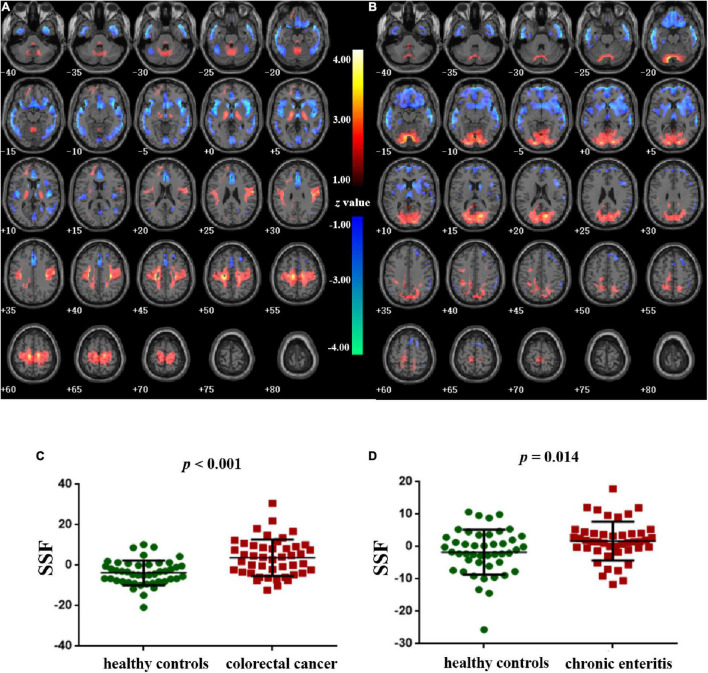
FIGURE 2.
Pattern identification of colorectal cancer and chronic enteritis. (A) The z-transformed colorectal cancer pattern (with |z| > 1) and the subject scaling factor (SSFs) (C) of the datasets. (B) The z-transformed chronic enteritis pattern (with |z| > 1) and the SSFs (D) of the datasets. Positive and negative z-values represent higher and lower metabolism, respectively, in the colorectal cancer/chronic enteritis group than in healthy controls. The z-coordinates of each slice are from –40 to 80 mm with a slice spacing of 5 mm.

