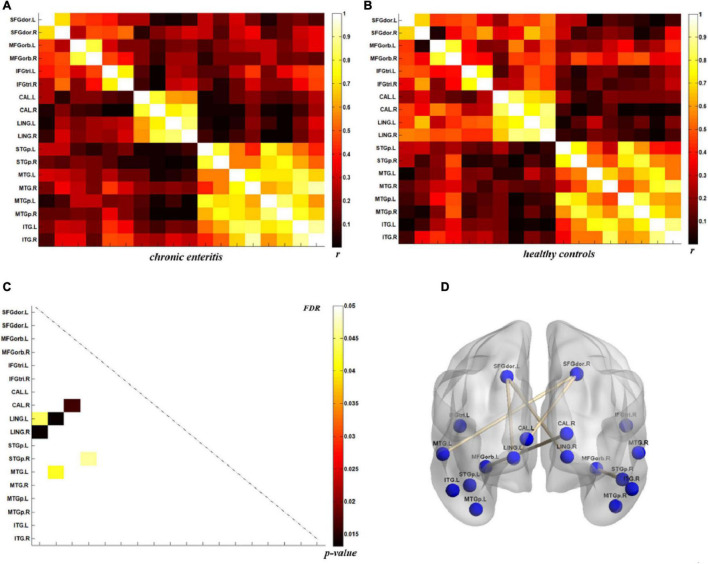
FIGURE 5.
Metabolic connectivity of brain regions related to psychological processes in the chronic enteritis group and healthy controls. (A,B) The r-value maps for chronic enteritis patients and healthy controls, respectively. (C) To find statistically significant differences in metabolic connectivity between models and controls, we calculated p-values for connections using a permutation test (p < 0.05). Significant differences in metabolic connectivity after false discovery rate (FDR) correction are represented by the upper triangular matrix, and those without FDR correction are represented by the lower triangular matrix. (D) The anatomical distribution of significantly different links between patients with chronic enteritis and healthy controls. r: correlation coefficient.

