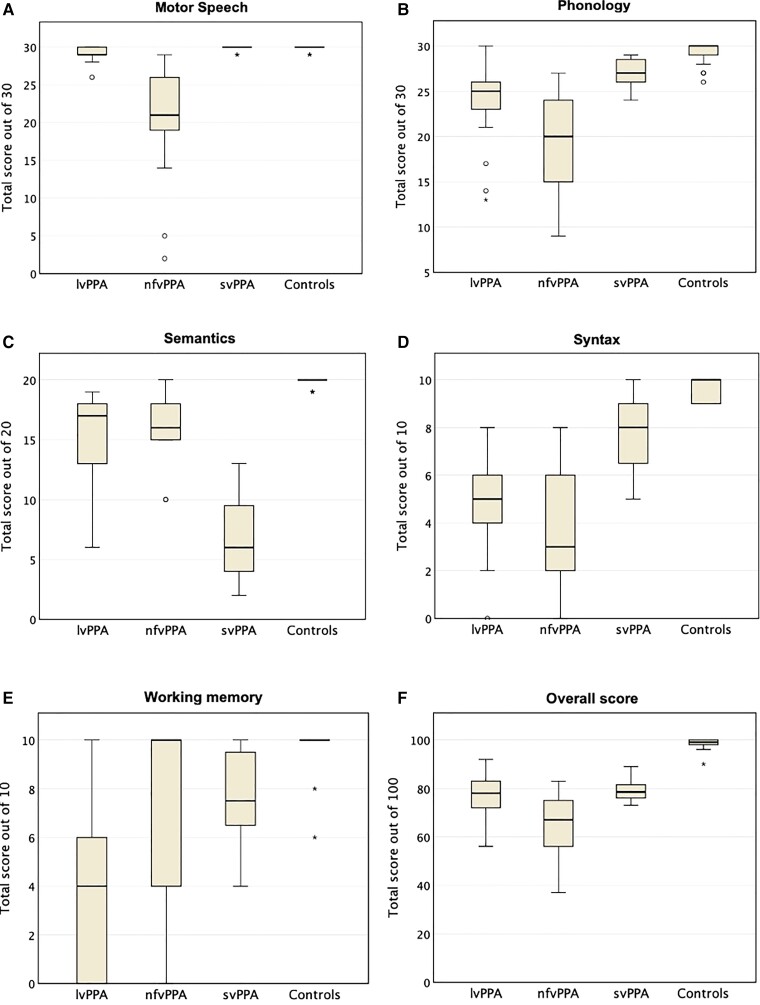
Figure 1.
MLSE domain scores (A–E) and total score (F) grouped by diagnosis. The boxes represent IQRs, horizontal lines the medians and error bars the minimum and maximum values excluding outliers. The latter are represented by the symbols ‘circle’ (values which are between 1.5 and 3.0 times the IQR below the first quartile or above the third) and ‘asterisk’ (values which are >3.0 times the IQR below the first quartile or above the third).

